. 2016 Oct 13;7(10):e2405.
doi: 10.1038/cddis.2016.314.

Ras signaling regulates osteoprogenitor cell proliferation and bone formation

Affiliations

Ras signaling regulates osteoprogenitor cell proliferation and bone formation

Garyfallia Papaioannou et al. Cell Death Dis. .

Abstract

During endochondral bone development, osteoblasts are continuously differentiated from locally residing progenitor cells. However, the regulation of such endogenous osteoprogenitor cells is still poorly understood mainly due to the difficulty in identifying such cells in vivo. In this paper, we genetically labeled different cell populations of the osteoblast linage using stage-specific, tamoxifen-inducible Cre transgenic mice to investigate their responses to a proliferative stimulus. We have found that overactivation of Kras signaling in type II collagen-positive, immature osteoprogenitor cells, but not in mature osteoblasts, substantially increases the number of their descendant stromal cells and mature osteoblasts, and subsequently increases bone mass. This effect was mediated by both, the extracellular signal-regulated kinase (ERK) and phosphoinositide 3 kinase (PI3K), pathways. Thus we demonstrate that Ras signaling stimulates proliferation of immature osteoprogenitor cells to increase the number of their osteoblastic descendants in a cell-autonomous fashion.


Figures
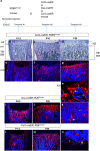
Figure 1
Figure 1
The fate and localization of bone-forming cells: Col2-, Osx- and Col1-positive cells during bone development (see also Supplementary Figure S1). (a) Experimental design. R26R-tdTomato reporter mice were crossed with transgenic mice expressing creER under the control of Col1, Osx and Col2 promoters. A single dose of tamoxifen (0.1 mg/g) was intraperitoneally (i.p.) injected into pregnant mothers at E18.5. (b-d) Hematoxylin/eosin-stained paraffin sections of the proximal metaphysis of the tibia at indicated ages (P=postnatal day, TB=trabecular bone, BM=bone marrow, HZ=hypertrophic chondrocyte zone). (e-g) Fluorescent images of the tibia of B-D (× 10). Blue:Dapi; Red:Tomato red fluorescent protein. (h) A cryosection (× 20 magnification) of the secondary ossification center in the Col2-creER;R26Rtomato mouse tibia at P28. Tomato-labeled cells are observed on the bone surface (osteoblasts; thick arrow), inside of the bone matrix (osteocytes; thin arrow), and in the bone marrow (dotted arrow). (i-j) Cryosections (× 10 magnification) of the Osx-creER;R26Rtomato mouse tibiae at indicated ages. Blue, DAPI; red, Tomato red fluorescent protein. (k) Cryosection (× 10 magnification) of the Osx-creER;R26Rtomato mouse tibia bone marrow at P28. Blue: DAPI; red: Tomato red fluorescent protein; thick arrow: osteoblasts; thin arrow: osteocytes; dotted arrow: stromal cells. (l-m) Cryosections (× 10 magnification) of the Col1-creER;R26Rtomato mouse tibia pulsed with tamoxifen at age E18.5. Tomato (red fluorescent protein) labeled the Col1-positive cells at age E18.5 and cell fate was chased at ages P1.5 and P28. (n) Cryosection of Col1-creER;R26Rtomato mouse tibia showing the secondary ossification center (× 20 magnification) at P28. Blue, DAPI; red, Tomato red fluorescent protein. thin arrow: osteocytes; thick arrow: osteoblasts. No tomato-positive cells were found in the bone marrow. n=5 mice per group
Figure 2
Figure 2
Expression of KrasG12D in Col2-positive cells at E18.5 increases the number of their descendants and the trabecular bone mass (see also Supplementary figure S2). (a-d) Tomato-positive cells in the tibial metaphysis of Col2-creER;R26Rtomato mice with wild-type Kras (a, c) and KrasG12D (b,d) at P1.5. Mice were treated with tamoxifen at E18.5. A,B: × 4 magnification. c,d: × 20 magnification. Blue, DAPI; red, Tomato red fluorescent protein. Dotted lines indicate the borders of tibia. The middle dotted line indicates the border between growth plate and primary spongiosa (trabecular bone). Magnifications of primary spongiosa of a and b are shown in c and d respectively (n=3). (e-h) Tomato-positive cells in the tibial metaphysis of Col2-creER;R26Rtomato mice with wild-type Kras (e,g) and KrasG12D (f,h) at P28. The mice were treated with tamoxifen at E18.5. E,F: × 4 magnification. g,h: × 20 magnification. Blue, DAPI; red, Tomato red fluorescent protein; arrow: osteocytes; double arrow: osteoblasts; dotted arrow: stromal cells (n=4). (i-j) Hematoxylin/eosin-stained paraffin sections of tibias at P28 from Col2-creER mice with wild-type Kras (i) and KrasG12D (j) after Kras activation at E18.5 (× 4 magnification). Mice harboring KrasG12D show increased trabecular bone with a minimal effect in the growth plate structure (n=8). (k-l) MicroCT pictures of tibias at P28 from Col2-creER mice with wild-type Kras (k) and KrasG12D (l) after Kras activation at E18.5. (m-p) Graphs showing comparisons of bone volume fraction (m), trabecular number (n), trabecular thickness (o) and trabecular separation (p) measured by microCT in mice with wild-type Kras or KrasG12D at P28 (n=3 and n=4 for mutant and control groups, respectively)
Figure 3
Figure 3
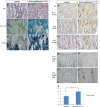
Activation of Kras oncogene in Col2 cells at perinatal age increases stromal cell numbers (see also Supplementary figure S3). (a-b) Hematoxylin/eosin-stained paraffin sections showing the stromal cells between the trabeculae in P28 mice (secondary spongiosa) control (a) and KrasG12D (b) after Kras activation at E18.5. × 40 magnification. (c-f) In situ hybridization for collagen 1 (Col1 ISH) (c,d) and osteocalcin (Oc ISH) (e,f) in the secondary spongiosa of P28-old mice control (c,e) or KrasG12D (d,f) after tamoxifen injection at E18.5. Stromal cells are not stained for these markers. Black arrows, osteoblasts; red asterisks, stromal cells. (g-j) Immunohistochemistry for p-ERK at P1.5 (g,h) and P10 (i,j) in the tibia secondary spongiosa of control (g, i) and KrasG12D (h, j) after tamoxifen injection at E18.5. Arrows show representative cells stained with anti- p-ERK. (k-l) Immunohistochemistry for p-Akt at P10 in the tibia secondary spongiosa of control (k) or KrasG12D (l) after tamoxifen injection at E18.5. Arrows show representative cells stained with anti- p-Akt antibody. (m-p) BrdU (Bromodeoxyuridine) labeling of proliferating cells in the metaphysis of mice (tibia) control (m,o) and KrasG12D (n,p) at P10 after Kras activation at E18.5. BrdU-positive cells are stained brown. (q) The BrdU index, calculated as the percentage of BrdU-labeled stromal cells, was significantly increased upon KrasG12D activation. Stromal cells were defined as the non-hematopoietic cells that were not attached to the bone matrix. Data are represented as mean±S.E.M.; n=3, *P=0.002
Figure 4
Figure 4
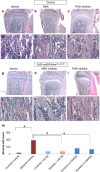
The MAPK and PI3K pathways are responsible for the increase in bone. (a-f) Hematoxylin/eosin-stained paraffin sections of tibias from Col2-creER or KrasG12D (control) mice at P21 (tamoxifen injection at E18.5) treated with vehicle (methylcellulose) (a,d), MEK inhibitor (U0126; 5 mg/kg) (b,e), or PI3K inhibitor (LY294002 100 mg/kg) (c,f). (g-l) Hematoxylin/eosin-stained paraffin sections of tibias from Col2-creER;KrasLSL-G12D/+ mice at P21 after tamoxifen injection at E18.5 (g,j), with MEK inhibitor U0126 injections (h,k) or PI3K inhibitor LY294002 injections (i,l). After MEK or PI3K inhibition, mice harboring KrasG12D show reduced trabecular bone and significantly smaller number of stromal cells than the vehicle-injected mutants. a,b,c, g, h, i: × 4 magnification. d, e, f,j, k, l: × 40 magnification. (m) Stromal cell counts in control and mutant mice injected with vehicle or MEK inhibitor or PI3K inhibitor. Data are represented as mean±S.E.M.; n=3, *P<0.05. Spindle-shaped cells, not attached to the bone matrix were counted in the center of secondary spongiosa in × 20 magnification
Figure 5
Figure 5
Overexpression of Kras in Osx cells perinatally causes a milder increase in bone and stromal cells, while in Col1 cells it has no effect (see also Supplementary figure S4). (a-b) Hematoxylin/eosin-stained paraffin sections of tibias from P28-old Osx-creER mice control (a,c) and KrasG12D (b,d) after Kras activation at E18.5. a,b: × 4 magnification, c,d: × 40 magnification. (e-h) Cryosections showing tomato-positive cells in P28-old Osx-creER mice control (e,g) and KrasG12D (f,h) after tamoxifen injection at E18.5. e,f × 4 magnification; g,h × 10 magnification. Blue, DAPI; red, Tomato red fluorescent protein. (i-l) Hematoxylin/eosin-stained paraffin sections of tibias from P28 Col1-creER mice control (i,k) and KrasG12D (j,l) after tamoxifen injection at E18.5. i,j: × 4 magnification, k,l: × 40 magnification. (m-p) Cryosections showing tomato-positive cells in P28 Col1-creER mice with wild-type Kras (m,o) and KrasG12D (n,p) after tamoxifen injection at E18.5. m,n: × 4 magnification, o,p: × 20 magnification. Blue, DAPI; red, Tomato red fluorescent protein. For both the Osx model and Col1 model n=5 mice per group

Similar articles

Cited by

References

    1. Sims NA, Vrahnas C. Regulation of cortical and trabecular bone mass by communication between osteoblasts, osteocytes and osteoclasts. Arch biochem biophys 2014; 561: 22–28. - PubMed
    1. Marie PJ. Transcription factors controlling osteoblastogenesis. Arch biochem biophys 2008; 473: 98–105. - PubMed
    1. Maes C, Kobayashi T, Selig MK, Torrekens S, Roth SI, Mackem S et al. Osteoblast precursors, but not mature osteoblasts, move into developing and fractured bones along with invading blood vessels. Dev cell 2010; 19: 329–344. - PMC - PubMed
    1. Ono N, Ono W, Nagasawa T, Kronenberg HM. A subset of chondrogenic cells provides early mesenchymal progenitors in growing bones. Nat cell biol 2014; 16: 1157–1167. - PMC - PubMed
    1. Park D, Spencer JA, Koh BI, Kobayashi T, Fujisaki J, Clemens TL et al. Endogenous bone marrow MSCs are dynamic, fate-restricted participants in bone maintenance and regeneration. Cell stem cell 2012; 10: 259–272. - PMC - PubMed

MeSH terms

  NODES
twitter 2