Multiparametric magnetic resonance imaging for the assessment of non-alcoholic fatty liver disease severity
- PMID: 27778429
- PMCID: PMC5518289
- DOI: 10.1111/liv.13284
Multiparametric magnetic resonance imaging for the assessment of non-alcoholic fatty liver disease severity
Abstract
Background & aims: The diagnosis of non-alcoholic steatohepatitis and fibrosis staging are central to non-alcoholic fatty liver disease assessment. We evaluated multiparametric magnetic resonance in the assessment of non-alcoholic steatohepatitis and fibrosis using histology as standard in non-alcoholic fatty liver disease.
Methods: Seventy-one patients with suspected non-alcoholic fatty liver disease were recruited within 1 month of liver biopsy. Magnetic resonance data were used to define the liver inflammation and fibrosis score (LIF 0-4). Biopsies were assessed for steatosis, lobular inflammation, ballooning and fibrosis and classified as non-alcoholic steatohepatitis or simple steatosis, and mild or significant (Activity ≥2 and/or Fibrosis ≥2 as defined by the Fatty Liver Inhibition of Progression consortium) non-alcoholic fatty liver disease. Transient elastography was also performed.
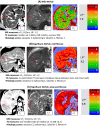
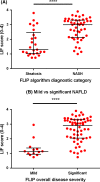
Results: Magnetic resonance success rate was 95% vs 59% for transient elastography (P<.0001). Fibrosis stage on biopsy correlated with liver inflammation and fibrosis (rs =.51, P<.0001). The area under the receiver operating curve using liver inflammation and fibrosis for the diagnosis of cirrhosis was 0.85. Liver inflammation and fibrosis score for ballooning grades 0, 1 and 2 was 1.2, 2.7 and 3.5 respectively (P<.05) with an area under the receiver operating characteristic curve of 0.83 for the diagnosis of ballooning. Patients with steatosis had lower liver inflammation and fibrosis (1.3) compared to patients with non-alcoholic steatohepatitis (3.0) (P<.0001); area under the receiver operating characteristic curve for the diagnosis of non-alcoholic steatohepatitis was 0.80. Liver inflammation and fibrosis scores for patients with mild and significant non-alcoholic fatty liver disease were 1.2 and 2.9 respectively (P<.0001). The area under the receiver operating characteristic curve of liver inflammation and fibrosis for the diagnosis of significant non-alcoholic fatty liver disease was 0.89.
Conclusions: Multiparametric magnetic resonance is a promising technique with good diagnostic accuracy for non-alcoholic fatty liver disease histological parameters, and can potentially identify patients with non-alcoholic steatohepatitis and cirrhosis.
Keywords: diagnostic accuracy; non-alcoholic steatohepatitis; non-invasive test; sensitivity and specificity.
© 2017 The Authors Liver International Published by John Wiley & Sons Ltd.
Figures


Similar articles
-
Quantitative multiparametric magnetic resonance imaging can aid non-alcoholic steatohepatitis diagnosis in a Japanese cohort.World J Gastroenterol. 2021 Feb 21;27(7):609-623. doi: 10.3748/wjg.v27.i7.609. World J Gastroenterol. 2021. PMID: 33642832 Free PMC article.
-
Magnetic Resonance Elastography vs Transient Elastography in Detection of Fibrosis and Noninvasive Measurement of Steatosis in Patients With Biopsy-Proven Nonalcoholic Fatty Liver Disease.Gastroenterology. 2017 Feb;152(3):598-607.e2. doi: 10.1053/j.gastro.2016.10.026. Epub 2016 Oct 27. Gastroenterology. 2017. PMID: 27911262 Free PMC article.
-
MR elastography is effective for the non-invasive evaluation of fibrosis and necroinflammatory activity in patients with nonalcoholic fatty liver disease.Eur J Radiol. 2018 Jan;98:82-89. doi: 10.1016/j.ejrad.2017.11.003. Epub 2017 Nov 11. Eur J Radiol. 2018. PMID: 29279175
-
Noninvasive Assessment of Liver Disease in Patients With Nonalcoholic Fatty Liver Disease.Gastroenterology. 2019 Apr;156(5):1264-1281.e4. doi: 10.1053/j.gastro.2018.12.036. Epub 2019 Jan 18. Gastroenterology. 2019. PMID: 30660725 Free PMC article. Review.
-
An individual patient data meta-analysis to determine cut-offs for and confounders of NAFLD-fibrosis staging with magnetic resonance elastography.J Hepatol. 2023 Sep;79(3):592-604. doi: 10.1016/j.jhep.2023.04.025. Epub 2023 Apr 29. J Hepatol. 2023. PMID: 37121437 Free PMC article. Review.
Cited by
-
Ability of dynamic gadoxetic acid-enhanced magnetic resonance imaging combined with water-specific T1 mapping to reflect inflammation in a rat model of early-stage nonalcoholic steatohepatitis.Quant Imaging Med Surg. 2024 Feb 1;14(2):1591-1601. doi: 10.21037/qims-23-482. Epub 2024 Jan 2. Quant Imaging Med Surg. 2024. PMID: 38415124 Free PMC article.
-
Multiparametric Magnetic Resonance Imaging and Magnetic Resonance Elastography to Evaluate the Early Effects of Bariatric Surgery on Nonalcoholic Fatty Liver Disease.Int J Biomed Imaging. 2023 Jul 19;2023:4228321. doi: 10.1155/2023/4228321. eCollection 2023. Int J Biomed Imaging. 2023. PMID: 37521027 Free PMC article.
-
Magnetic resonance imaging T1 relaxation times for the liver, pancreas and spleen in healthy children at 1.5 and 3 tesla.Pediatr Radiol. 2019 Jul;49(8):1018-1024. doi: 10.1007/s00247-019-04411-7. Epub 2019 May 2. Pediatr Radiol. 2019. PMID: 31049609
-
Advanced MRI of Liver Fibrosis and Treatment Response in a Rat Model of Nonalcoholic Steatohepatitis.Radiology. 2020 Jul;296(1):67-75. doi: 10.1148/radiol.2020192118. Epub 2020 Apr 28. Radiology. 2020. PMID: 32343209 Free PMC article.
-
Road to identifying endpoint biomarkers in the treatment of nonalcoholic steatohepatitis: are we there yet?Hepatobiliary Surg Nutr. 2020 Apr;9(2):244-246. doi: 10.21037/hbsn.2019.10.02. Hepatobiliary Surg Nutr. 2020. PMID: 32355692 Free PMC article. No abstract available.
References
-
- Wong VW, Chu WC, Wong GL, et al. Prevalence of non‐alcoholic fatty liver disease and advanced fibrosis in Hong Kong Chinese: a population study using proton‐magnetic resonance spectroscopy and transient elastography. Gut 2012;61:409–415. - PubMed
-
- Williams CD, Stengel J, Asike MI, et al. Prevalence of nonalcoholic fatty liver disease and nonalcoholic steatohepatitis among a largely middle‐aged population utilizing ultrasound and liver biopsy: a prospective study. Gastroenterology 2011;140:124–131. - PubMed
-
- Hyysalo J, Mannisto VT, Zhou Y, et al. A population‐based study on the prevalence of NASH using scores validated against liver histology. J Hepatol 2014;60:839–846. - PubMed
-
- Wong RJ, Aguilar M, Cheung R, et al. Nonalcoholic steatohepatitis is the second leading etiology of liver disease among adults awaiting liver transplantation in the United States. Gastroenterology, 2015;148:547–555. - PubMed
-
- Ekstedt M, Hagstrom H, Nasr P, et al. Fibrosis stage is the strongest predictor for disease‐specific mortality in NAFLD after up to 33 years of follow‐up. Hepatology. 2015;61:1547–1554. - PubMed
Publication types
MeSH terms
Grants and funding
LinkOut - more resources
Full Text Sources
Other Literature Sources
Medical

