. 2016 Dec 1;311(6):L1245-L1258.
doi: 10.1152/ajplung.00253.2016. Epub 2016 Oct 28.

Gene expression profiling of epigenetic chromatin modification enzymes and histone marks by cigarette smoke: implications for COPD and lung cancer

Affiliations

Gene expression profiling of epigenetic chromatin modification enzymes and histone marks by cigarette smoke: implications for COPD and lung cancer

Isaac K Sundar et al. Am J Physiol Lung Cell Mol Physiol. .

Abstract

Chromatin-modifying enzymes mediate DNA methylation and histone modifications on recruitment to specific _target gene loci in response to various stimuli. The key enzymes that regulate chromatin accessibility for maintenance of modifications in DNA and histones, and for modulation of gene expression patterns in response to cigarette smoke (CS), are not known. We hypothesize that CS exposure alters the gene expression patterns of chromatin-modifying enzymes, which then affects multiple downstream pathways involved in the response to CS. We have, therefore, analyzed chromatin-modifying enzyme profiles and validated by quantitative real-time PCR (qPCR). We also performed immunoblot analysis of _targeted histone marks in C57BL/6J mice exposed to acute and subchronic CS, and of lungs from nonsmokers, smokers, and patients with chronic obstructive pulmonary disease (COPD). We found a significant increase in expression of several chromatin modification enzymes, including DNA methyltransferases, histone acetyltransferases, histone methyltransferases, and SET domain proteins, histone kinases, and ubiquitinases. Our qPCR validation data revealed a significant downregulation of Dnmt1, Dnmt3a, Dnmt3b, Hdac2, Hdac4, Hat1, Prmt1, and Aurkb We identified _targeted chromatin histone marks (H3K56ac and H4K12ac), which are induced by CS. Thus CS-induced genotoxic stress differentially affects the expression of epigenetic modulators that regulate transcription of _target genes via DNA methylation and site-specific histone modifications. This may have implications in devising epigenetic-based therapies for COPD and lung cancer.

Keywords: COPD; chromatin modifications; cigarette smoke; epigenetics; epithelial cells; lungs.


Figures

Fig. 1.
Fig. 1.
Gene expression profiles of chromatin modification enzymes that were increased above or below 1.5-fold cutoff in 24-h control vs. CSE-treated H292 cells. Human bronchial epithelial cells were treated for 24 h with or without CSE. RNA extracted from control and CSE-treated (1%) cells was analyzed using RT2 Profiler PCR array for human epigenetic chromatin modification enzymes. A: scatterplot analysis of human chromatin modification enzymes show marked upregulation or downregulation of genes by ≥ or ≤1.5-fold in 24-h control vs. CSE-treated (1%) H292 cells. Red denotes high expression (upregulated), and green denotes low expression (downregulated). Values are means ± SE (n = 4/group). B: table shows gene symbol, fold change, P value (Student's t-test; P < 0.01), and Benjamini-Hochberg adjusted P value (multiple-_target analysis) for genes altered by CSE compared with control.
Fig. 2.
Fig. 2.
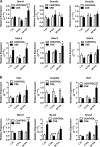
Gene expression of DNA methyltransferases, histone deacetylases, histone acetyltransferases, histone methyltransferases and SET domain proteins, histone phosphorylation, and histone ubiquitination enzymes at 1, 4, and 24 h in CSE-treated H292 cells. Human bronchial epithelial cells were treated with and without CSE for 1 h (2% CSE) and 4 and 24 h (1% CSE). RNA extracted from control and CSE-treated cells was analyzed using RT2 Profiler PCR array for human epigenetic chromatin modification enzymes. A: the transcription levels of genes encoding specific DNMTs (Dnmt1, Dnmt3a, and Dnmt3b) and HDACs (Hdac2, Hdac3, and Hdac4) were examined by qPCR using the 2−ΔΔCt method. B: the transcription levels of genes encoding specific HATs (Cdyl, Csrp2bp, Hat1, Myst3, Myst4, and Ncoa3) were examined by qPCR using the 2−ΔΔCt method. C: the transcription levels of genes encoding specific HMTs (Prmt1, Prmt5, and Nsd1) and SET domain proteins (Setdb2, Setd4, and Setd5) were examined by qPCR using the 2−ΔΔCt method. D: the transcription levels of genes encoding specific histone phosphorylation (Aurkc and Nek6) and histone ubiquitination (Ube2b, Usp16, and Usp22) were examined by qPCR using the 2−ΔΔCt method. Bar graphs represent the mean normalized expression of samples in control vs. CSE-treated H292 cells. Data were normalized using the endogenous housekeeping gene ribosomal protein L13a (Rpl13a) as reference and controls as calibrators. Statistical significance (P < 0.05) was analyzed by two-way ANOVA (Tukey's multiple-comparison test) using GraphPad Prism 6. Values are means ± SE (n = 4/group). *P < 0.05, **P < 0.01, and ***P < 0.001 vs. control. #P < 0.05, ##P < 0.01, and ###P < 0.001 vs. CSE (1 or 4 h).
Fig. 2.
Fig. 2.
Gene expression of DNA methyltransferases, histone deacetylases, histone acetyltransferases, histone methyltransferases and SET domain proteins, histone phosphorylation, and histone ubiquitination enzymes at 1, 4, and 24 h in CSE-treated H292 cells. Human bronchial epithelial cells were treated with and without CSE for 1 h (2% CSE) and 4 and 24 h (1% CSE). RNA extracted from control and CSE-treated cells was analyzed using RT2 Profiler PCR array for human epigenetic chromatin modification enzymes. A: the transcription levels of genes encoding specific DNMTs (Dnmt1, Dnmt3a, and Dnmt3b) and HDACs (Hdac2, Hdac3, and Hdac4) were examined by qPCR using the 2−ΔΔCt method. B: the transcription levels of genes encoding specific HATs (Cdyl, Csrp2bp, Hat1, Myst3, Myst4, and Ncoa3) were examined by qPCR using the 2−ΔΔCt method. C: the transcription levels of genes encoding specific HMTs (Prmt1, Prmt5, and Nsd1) and SET domain proteins (Setdb2, Setd4, and Setd5) were examined by qPCR using the 2−ΔΔCt method. D: the transcription levels of genes encoding specific histone phosphorylation (Aurkc and Nek6) and histone ubiquitination (Ube2b, Usp16, and Usp22) were examined by qPCR using the 2−ΔΔCt method. Bar graphs represent the mean normalized expression of samples in control vs. CSE-treated H292 cells. Data were normalized using the endogenous housekeeping gene ribosomal protein L13a (Rpl13a) as reference and controls as calibrators. Statistical significance (P < 0.05) was analyzed by two-way ANOVA (Tukey's multiple-comparison test) using GraphPad Prism 6. Values are means ± SE (n = 4/group). *P < 0.05, **P < 0.01, and ***P < 0.001 vs. control. #P < 0.05, ##P < 0.01, and ###P < 0.001 vs. CSE (1 or 4 h).
Fig. 3.
Fig. 3.
Gene expression profiles of chromatin modification enzymes that were increased above or below 1.2-fold cutoff in chronic (6 mo) air- vs. CS-exposed mouse lungs. C57BL6/J mice were exposed to chronic air or CS exposure. RNA extracted from air- and CS-exposed mice were analyzed using RT2 Profiler PCR array for mouse epigenetic chromatin modification enzymes. A: scatterplot analysis of mouse chromatin modification enzymes showing marked upregulation or downregulation of genes by ≥ or ≤1.2-fold in air- vs. CS-exposed mouse lungs. Red denotes high expression (upregulated), and green denotes low expression (downregulated). Values are means ± SE (n = 4/group). B: table showing gene symbol, fold change, P value (Student's t-test; P < 0.01), and Benjamini-Hochberg adjusted P value (multiple-_target analysis) for genes altered by CS compared with air.
Fig. 4.
Fig. 4.
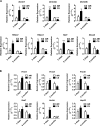
Gene expression of DNA methyltransferases, histone deacetylases, histone acetyltransferases, histone methyltransferases, histone phosphorylation, and histone ubiquitination in acute and chronic air- vs. CS-exposed mouse lungs. C57BL6/J mice were exposed to acute (3 days) and chronic (6 mo) air or CS. RNA extracted from air- and CS-exposed mice were analyzed using qPCR primers for specific mouse epigenetic chromatin modification enzymes. A: the transcription levels of genes encoding specific DNMTs (Dnmt1, Dnmt3a, and Dnmt3b), HDACs (Hdac2 and Hdac4), and HATs (Hat1 and Ncoa3) were examined by qPCR using the 2−ΔΔCt method. B: the transcription levels of genes encoding specific HMTs (Prmt1, Prmt5, Prmt8, and Nsd1), histone phosphorylation (Aurkc), and ubiquitination (Usp22) were examined by qPCR using the 2−ΔΔCt method. Bar graphs represent the mean normalized expression of samples in air group vs. CS-exposed mouse lung. Data were normalized using the endogenous housekeeping gene 18S rRNA as reference and air group control as calibrators. Statistical significance (P < 0.05) was analyzed by two-way ANOVA (Tukey's multiple-comparison test) using GraphPad Prism 6. Values are means ± SE (n = 4–6/group). *P < 0.05 and ***P < 0.001 vs. air. #P < 0.05, ##P < 0.01, and ###P < 0.001 vs. CS (3 days).
Fig. 5.
Fig. 5.
Acute CS exposure increased histone H3K56 acetylation in mouse lungs. Whole lung homogenates were used for immunoblot analysis against anti-histone H3K56 acetylation. The level of H3K56ac, but not H4K16ac, was increased in response to acute (3 days) CS exposure in mouse lungs. Both H3K56ac and H4K16ac remained unaltered in subchronic (1 mo) air- and CS-exposed mouse lungs. The band intensity was measured by densitometry, and data are shown as relative intensity to total histones H3/H4. Values are means ± SE (n = 4/group). *P < 0.05 vs. air.
Fig. 6.
Fig. 6.
Histone modifications in nonsmokers, smokers, and patients with COPD and with histone H4K12 acetylation. Whole lung homogenates from nonsmokers, smokers, and patients with COPD were used for immunoblot analysis against anti-histone H3K9ac, H3K56ac, H3K36me2, H3K79me2, H4K12ac, H4K16ac, H4K20me3, and total histone H3 and H4. Of all of the histone marks analyzed, the level of H4K12ac was significantly increased in lungs of patients with COPD. The band intensity was measured by densitometry, and data are shown as relative intensity to total histones H3/H4. Values are means ± SE (n = 4/group). **P < 0.01 vs. nonsmoker. #P < 0.05 vs. smoker.

Similar articles

Cited by

References

    1. Adenuga D, Rahman I. Protein kinase CK2-mediated phosphorylation of HDAC2 regulates co-repressor formation, deacetylase activity and acetylation of HDAC2 by cigarette smoke and aldehydes. Arch Biochem Biophys 498: 62–73, 2010. - PMC - PubMed
    1. Adenuga D, Yao H, March TH, Seagrave J, Rahman I. Histone deacetylase 2 is phosphorylated, ubiquitinated, and degraded by cigarette smoke. Am J Respir Cell Mol Biol 40: 464–473, 2009. - PMC - PubMed
    1. Barrero CA, Perez-Leal O, Aksoy M, Moncada C, Ji R, Lopez Y, Mallilankaraman K, Madesh M, Criner GJ, Kelsen SG, Merali S. Histone 3.3 participates in a self-sustaining cascade of apoptosis that contributes to the progression of COPD. Am J Respir Crit Care Med 188: 673–683, 2013. - PMC - PubMed
    1. Berger SL. Histone modifications in transcriptional regulation. Curr Opin Genet Dev 12: 142–148, 2002. - PubMed
    1. Butler JS, Koutelou E, Schibler AC, Dent SY. Histone-modifying enzymes: regulators of developmental decisions and drivers of human disease. Epigenomics 4: 163–177, 2012. - PMC - PubMed

MeSH terms

LinkOut - more resources

  NODES
Association 1
chat 1
Note 4
twitter 2