Probing electrical signals in the retina via graphene-integrated microfluidic platforms
- PMID: 27812594
- PMCID: PMC5115917
- DOI: 10.1039/c6nr07290a
Probing electrical signals in the retina via graphene-integrated microfluidic platforms
Abstract
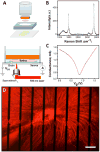
Graphene has attracted extensive attention in biological and biomedical fields due to its unique physical properties and excellent biocompatibility. We combine graphene field-effect transistors and scanning photocurrent microscopy with microfluidic platforms to investigate electrical signals in mouse retina. Remarkable photocurrent signals were detected from the graphene underneath the optic nerve head (ONH) of the retina, where the electrical activity from this region can modulate the carrier concentration of the graphene and induce local potential gradients. These built-in electrical potential gradients can efficiently separate photo-excited electron-hole pairs, leading to strong photocurrent responses in the graphene underneath the ONH. We also show that no significant photocurrent signal was observed in the graphene underneath either dehydrated or fixed retinal tissues, verifying that the photocurrent responses generated in the graphene underneath the ONH were indeed induced by the electrical activity in living retina. This method not only provides a way to investigate electrical processes in living retinal tissues, but also offers opportunities to study many other cellular systems involving cell-cell interactions through electrical signaling.
Figures


Similar articles
-
Focused-laser-enabled p-n junctions in graphene field-effect transistors.ACS Nano. 2013 Jul 23;7(7):5850-7. doi: 10.1021/nn402354j. Epub 2013 Jun 21. ACS Nano. 2013. PMID: 23782162
-
Ultrafast Lateral Photo-Dember Effect in Graphene Induced by Nonequilibrium Hot Carrier Dynamics.Nano Lett. 2015 Jun 10;15(6):4234-9. doi: 10.1021/acs.nanolett.5b01912. Epub 2015 May 22. Nano Lett. 2015. PMID: 25993273
-
Imaging of photocurrent generation and collection in single-layer graphene.Nano Lett. 2009 May;9(5):1742-6. doi: 10.1021/nl8029493. Nano Lett. 2009. PMID: 19326919
-
In Vivo Observations of Rapid Scattered Light Changes Associated with Neurophysiological Activity.In: Frostig RD, editor. In Vivo Optical Imaging of Brain Function. 2nd edition. Boca Raton (FL): CRC Press/Taylor & Francis; 2009. Chapter 5. In: Frostig RD, editor. In Vivo Optical Imaging of Brain Function. 2nd edition. Boca Raton (FL): CRC Press/Taylor & Francis; 2009. Chapter 5. PMID: 26844322 Free Books & Documents. Review.
-
[In vivo measurement of ocular circulation with the laser speckle method--development of apparatus and application in ophthalmological research].Nippon Ganka Gakkai Zasshi. 1999 Dec;103(12):871-909. Nippon Ganka Gakkai Zasshi. 1999. PMID: 10643292 Review. Japanese.
Cited by
-
Probing Light-Stimulated Activities in the Retina via Transparent Graphene Electrodes.ACS Appl Bio Mater. 2022 Jan 17;5(1):305-312. doi: 10.1021/acsabm.1c01091. Epub 2022 Jan 6. ACS Appl Bio Mater. 2022. PMID: 35034456 Free PMC article.
-
Impact of Graphene on the Efficacy of Neuron Culture Substrates.Adv Healthc Mater. 2018 Jul;7(14):e1701290. doi: 10.1002/adhm.201701290. Epub 2018 Jun 25. Adv Healthc Mater. 2018. PMID: 29943431 Free PMC article.
-
Graphene Family Nanomaterials in Ocular Applications: Physicochemical Properties and Toxicity.Chem Res Toxicol. 2021 Jun 21;34(6):1386-1402. doi: 10.1021/acs.chemrestox.0c00340. Epub 2021 May 27. Chem Res Toxicol. 2021. PMID: 34041903 Free PMC article. Review.
-
In situ monitoring of electrical and optoelectronic properties of suspended graphene ribbons during laser-induced morphological changes.Nanoscale Adv. 2020 Jul 17;2(9):4034-4040. doi: 10.1039/d0na00413h. eCollection 2020 Sep 16. Nanoscale Adv. 2020. PMID: 36132770 Free PMC article.
-
Microfluidics for interrogating live intact tissues.Microsyst Nanoeng. 2020 Aug 24;6:69. doi: 10.1038/s41378-020-0164-0. eCollection 2020. Microsyst Nanoeng. 2020. PMID: 32879734 Free PMC article. Review.
References
-
- Abrey LE, Batchelor TT, Ferreri AJ, Gospodarowicz M, Pulczynski EJ, Zucca E, Smith JR, Korfel A, Soussain C, DeAngelis LM. Journal of clinical oncology. 2005;23:5034–5043. - PubMed
-
- Iseri PK, Altinas Ö, Tokay T, Yüksel N. Journal of neuro-ophthalmology. 2006;26:18–24. - PubMed
-
- Imamura Y, Fujiwara T, Margolis R, Spaide RF. Retina. 2009;29:1469–1473. - PubMed
-
- London A, Benhar I, Schwartz M. Nature Reviews Neurology. 2013;9:44–53. - PubMed
Grants and funding
LinkOut - more resources
Full Text Sources
Other Literature Sources

