. 2017 Jan 12;168(1-2):224-238.e10.
doi: 10.1016/j.cell.2016.11.042. Epub 2016 Dec 22.

Prohibitin 2 Is an Inner Mitochondrial Membrane Mitophagy Receptor

Affiliations

Prohibitin 2 Is an Inner Mitochondrial Membrane Mitophagy Receptor

Yongjie Wei et al. Cell. .

Abstract

The removal of unwanted or damaged mitochondria by autophagy, a process called mitophagy, is essential for key events in development, cellular homeostasis, tumor suppression, and prevention of neurodegeneration and aging. However, the precise mechanisms of mitophagy remain uncertain. Here, we identify the inner mitochondrial membrane protein, prohibitin 2 (PHB2), as a crucial mitophagy receptor involved in _targeting mitochondria for autophagic degradation. PHB2 binds the autophagosomal membrane-associated protein LC3 through an LC3-interaction region (LIR) domain upon mitochondrial depolarization and proteasome-dependent outer membrane rupture. PHB2 is required for Parkin-induced mitophagy in mammalian cells and for the clearance of paternal mitochondria after embryonic fertilization in C. elegans. Our findings pinpoint a conserved mechanism of eukaryotic mitophagy and demonstrate a function of prohibitin 2 that may underlie its roles in physiology, aging, and disease.

Keywords: autophagy; mitophagy; prohibitin 2.


Figures

Figure 1
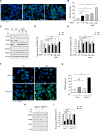
Figure 1. PHB2 Interacts with LC3-II during Mitophagy
(A) Isolation of Flag-StrepII-LC3 complexes by Strep-Tactin pull-down followed by anti-Flag immunoprecipitation from HeLa/Parkincells stably expressingFlag-StrepII-LC3 and treated with either DMSO (control) or 10μM CCCP (mitochondrial uncoupling agent) for 4 hr. Top gel:silver stainofFlag-StrepII-LC3 complexes. Labeled bands were identified by mass spectrometry analysis. F/S, Flag-StrepII. Bottom gels: western blot analyses of Flag-StrepII-complexes with indicated antibodies. (B) Co-immunoprecipitation of LC3-II with anti-PHB1 or anti-PHB2 in HeLa/Control or HeLa/Parkin cells treated with either DMSO or OA (oligomycin, 2.5 μM; antimycin A, 250 nM) (mitochondrial electron transport chain inhibitors) for 4 hr. (C) Recombinant GST-PHB1 or GST-PHB2 pull-down of LC3-II from HeLa/Control or HeLa/Parkin cell lysates treated with DMSO or OA for 4 hr. Top: western blot analysis using anti-LC3 of GST-PHB pull-downs. Bottom left: western blot analysis of LC3 in whole cell lysates used for experiment on top. Bottom right: western blot analysis using anti-GST of purified recombinant GST proteins used for experiment on top. Asterisk denotes non-specific band. (D) In vitro interaction of purified GST-LC3 with StrepII-SUMO-PHB1 or StrepII-SUMO-PHB2. Top gel: western blot analysis using anti-Strep after GST pull-down. Bottom left gel: western blot using anti-Strep of purified StrepII-SUMO-PHB proteins used for experiment on top. Bottom right gel: Coomassie stain of purified GST proteins used for experiment on top. (E) Recombinant GST-PHB1 or GST-PHB2 pull-down of LC3-II from OA-treated HeLa/Parkin cell lysates treated with non-_targeting control (NC) or PHB2 dicer-substrate siRNA. Top: western blot analysis with anti-LC3 of GST-PHB pull-downs. Bottom left: western blot analysis of LC3 in whole cell lysates used for experiment on top. Bottom right: western blot analysis using anti-GST of purified recombinant GST proteins used for experiment on top. WCL, whole cell lysates. (F) Co-immunoprecipitation of GATE-16, GABARAP, or LC3-II with anti-PHB2 in HeLa/Parkin cells treated with either DMSO or OA for 4 hr. See also Figure S1.
Figure 2
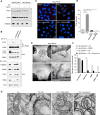
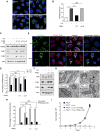
Figure 2. PHB2 Is Essential for Parkin-Mediated Mitophagy
(A) Representative images of ATP5B immunofluorescence staining of HeLa/Parkin cells transfected with indicated siRNA and treated with OA for 16 hr prior to imaging and automated image analysis. Scale bars, 20 μm. (B) Quantitation of cytoplasmic ATP5B puncta (as shown in representative images in A) in cells transfected with indicated siRNA and treated with OA. Shown are mean ± SEM of 150 cells analyzed per condition. Similar results were observed in three independent experiments. ***p < 0.001, one-way ANOVA with the Sidak test. (C–E) Western blot analysis of indicated mitophagy markers (C) in cells treated as shown in (A) and densitometric quantification of HSP60/ACTIN (D) and TIM50/ACTIN (E) ratios for western blot analyses of cells treated as in (A). Shown are mean ± SEM values from western blot analyses of three independent experiments. ***p < 0.001, two-way ANOVA for comparison of magnitude of change ± OA in indicated siRNA group versus NC RNA control. (F) Representative images of ATP5B immunofluorescence staining of Phb2+/+/Parkin or Phb2flox/flox/Parkin MEFs transduced with empty vector or a Cre-expressing lentivirus and treated with OA for 16 hr prior to imaging and automated image analysis. Scale bars, 20 μm. (G) Quantitation of cytoplasmic ATP5B puncta in cells of indicated genotype treated as shown in representative images displayed in (D). Shown are mean ± SEM of 150 cells analyzed per condition. Similar results were observed in three independent experiments. **p < 0.01; ****p < 0.0001; NS, not significant; one-way ANOVA with the Sidak test. (H and I) Western blot analysis of indicated mitophagy markers (H) in MEFs treated as shown in (D) and densitometric quantification of HSP60/actin ratios (I). Shown are mean ± SEM values from western blot analyses of three independent experiments. NS, not significant; ***p < 0.001; Two-way ANOVA for comparison of magnitude of change ± OA in indicated group versus Cre (−) Phb2+/+ group.
Figure 3
Figure 3. Proteasomal-Dependent Outer Mitochondrial Membrane Rupture Is Required for PHB2/LC3 Interaction and Mitophagy
(A) Protease protection assay of mitochondrial fractions purified from HeLa/Control or HeLa/Parkin cells treated with DMSO or OA for 4 hr. (B) Effects of proteasome inhibitors (5 mM lactacystin or 100 nM epoxomicin) on PHB2/LC3-II interaction, OMM rupture and mitophagy in HeLa/Parkin cells treated with OA for 4 hr (top gels assess co-immunoprecipitation of PHB2 and LC3) or 16 hr (bottom gels show western blots of indicated mitochondrial proteins). WCL, whole cell lysates. Similar results were observed in two independent experiments. (C and D) Representative images (C) and quantification (D) of Duolink in situ PLA assay demonstrating the interaction between LC3 and PHB2 in HeLa/Parkin/Flag.StrepII-LC3 cells in cells transfected with NC or PHB2 siRNA for 48 hr and then treated for 2 hr with either DMSO, OA, or OA + epoxomicin. In (D), bars are mean ± SEM for triplicate samples of >50 cells per sample. Similar results were obtained in three independent experiments. ***p < 0.001, *p < 0.05;one-way ANOVA. (E) Electron micrographs of mitochondria immunoprecipitated from HeLa/Parkin cells treated for 4 hr with OA in the presence or absence of epoxomicin. Right panels: higher magnification images of regions outlined in left panels. See also Figure S2. Asterisk, Dynabead. White scale bar, 500 nm. Black scale bar, 200 nm. (F) Quantitation of mitochondria with unruptured or ruptured membranes (further subdivided into mitochondria with OMM rupture only or rupture of both OMM and IMM [OMM + IMM]) in the experiment shown in (E). Fifty mitochondria per condition were examined by an observer blinded to experimental condition. **p < 0.01, Chi-square test. (G) Representative electron micrographs showing mitochondrial rupture in HeLa/Parkin cells transfected with NC or PHB2 siRNA and treated with OA with or without epoxomicin for 2 hr. White asterisk and white arrow, site of focal OMM rupture; black asterisks, sites of focal rupture of OMM and IMM. Scales bars, 100 μm.
Figure 4
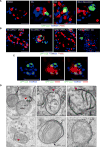
Figure 4. LC3 Localizes with the Mitochondrial Inner Membrane during Parkin-Mediated Mitophagy
(A) Representative SIM images showing colocalization of GFP-LC3, TOMM20, and PHB2 in HeLa/Parkin/GFP-LC3 cells treated for 2 hr with DMSO, OA, or OA + epoxomicin. Scale bars, 1 μm. (B) Representative SIM images showing colocalization of GFP-LC3, TOMM20, and TIM50 in NC or PHB2 siRNA-transfected HeLa/Parkin/GFP-LC3 cells treated with DMSO or OA for 2 hr. Scale bars, 1 μm. (C) Representative SIM image of mitochondrion in OA-treated HeLa/Parkin/GFP-LC3 cell stained as in (B) demonstrating colocalization of GFP-LC3 with IMM marker (TIM50) at site lacking OMM marker (TOMM20). Scale bars, 1 μm. (D) Electron micrographs of HeLa/Parkin/GFP-LC3 cells stained with immunogold-conjugated anti-GFP antibody to detect GFP-LC3. Cells were transfected with NC or PHB2 siRNA and treated for 2 hr with OA with or without epoxomicin. Red arrowheads, sites of OMM rupture. White arrows, immunogold particles labeling LC3 at sites of OMM rupture. Black arrows, immunogold particles labeling LC3 at membranes in vicinity of mitochondria. P, phagophore; Mito, mitochondrion; AL, autolysosome. Scale bars, 100 nm. In (A)–(C), high-resolution image data acquisition was performed on seven randomly chosen cells per sample, and similar results were observed in three independent experiments. In (D), ten randomly chosen cells were imaged per sample. Two technical replicates per condition were analyzed, and similar results were observed in four independent experiments. See also Figure S3.
Figure 5
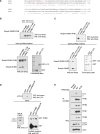
Figure 5. Identification of the LIR Domain of PHB2
(A) Sequence alignment of PHB1 and PHB2. Candidate LIR domains (W/F/YxxL/I/V motifs) are depicted in red. (B) In vitro interaction of purified GST-LC3 with indicated StrepII-SUMO-PHB2 constructs. Top: western blot analysis using anti-Strep after GST pull-down. Bottom left: western blot analysis using anti-Strep of purified StrepII-SUMO-PHB2 proteins used for experiment on top. Bottom right: Coomassie stain of purified GST fusion proteins used for experiment on top. (C) In vitro interaction of purified GST-LC3 with indicated StrepII-SUMO-PHB2 constructs. Top: western blot analysis using anti-Strep after GST pull-down. Bottom left: western blot analysis using anti-Strep of purified StrepII-SUMO-PHB2 proteins used for experiment on top. Bottom right: Coomassie stain of purified GST fusion proteins used for experiment on top. (D) Recombinant GST-PHB2 or GST-PHB2mLIR (Y121A/L124A) pull-down of LC3-II from HeLa/Parkin cell lysates treated with OA for 4 hr. Top: western blot analysis using anti-LC3 of GST-PHB pull-downs. Bottom left: western blot analysis of LC3 in whole cell lysates used for experiment on top. Bottom right: western blot analysis using anti-GST of purified recombinant GST proteins used for experiment on top. Asterisk denotes non-specific band. (E) Co-immunoprecipitation of LC3-II with wild-type (WT) PHB2-Myc in HeLa/Parkin cells treated with OA for 4 hr. Twenty-four hours prior to experiment, endogenous PHB2 and PHB1 were depleted with PHB2 siRNA, and cells were transfected with empty vector or indicated PHB2-Myc construct and non-tagged PHB1.
Figure 6
Figure 6. The LIR Domain of PHB2 Is Required for Parkin-Mediated Mitophagy
(A) Representative images of ATP5B immunofluorescence staining of Phb2flox/flox/Parkin MEFs transduced with empty vector or a Cre-expressing lentivirus and treated with OA for 16 hr prior to imaging and automated image analysis. Scale bars, 10 μm. (B) Quantitation of cytoplasmic ATP5B puncta in Phb2flox/flox/Parkin MEFs transduced with lentiviruses expressing proteins indicated below x axis. Shown are mean ± SEM of 150 cells analyzed per condition. Similar results were observed in three independent experiments. ***p < 0.001; NS, not significant; one-way ANOVA with the Sidak test. (C) Western blot analysis of indicated mitophagy markers in MEFs treated as shown in (A). (D) Densitometric quantification of HSP60/Actin in (C). Shown are mean ± SEM values from western blot analyses of three independent experiments. NS, not significant; ***p < 0.001; two-way ANOVA for comparison of magnitude of change ± OA in indicated group versus Cre (−) control group. (E) Representative images showing co-localization of PHB2-myc and HSP60 in HeLa/Parkin cells. Twenty-four hours prior to experiment, endogenous PHB2 and PHB1 were depleted with PHB2 siRNA and cells were co-transfected with indicated PHB2-myc construct and non-tagged PHB1. Scale bars, 10 μm. (F) Western blot analysis to detect OPA1 processing Phb2flox/flox/Parkin MEFs during normal growth conditions with or without expression of Cre and WT PHB2 or PHB2 mLIR. Similar results were observed in two independent experiments. (G) Representative images of mitochondria in MEFs shown in (F) that would be classified as lamellar (white arrows) or disorganized (black arrows). (H) Quantification of mitochondrial cristae morphology for MEFs shown in (F) and (G). For each genotype, mitochondria were scored in 50 cell profiles. Bars are mean ± SEM for triplicate samples per genotype. NS, not significant, ***p < 0.001; two-way ANOVA for comparison of magnitude of difference between lamellar versus disorganized mitochondria in indicated group as compared to Cre (−) control group. (I) Growth curves of MEFS of indicated genotype. Cells (2 × 10⁴) were plated and counted at serial time points. Bars are mean ± SEM of triplicate samples for each genotype at each time point. p < 0.0001 for Phb2f/f + Cre versus all other groups; liner mixed-model effect. No differences were observed between Phb2f/f + Cre + WT PHB2 versus Phb2f/f + Cre + PHB2 mLIR.
Figure 7
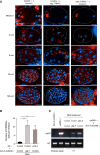
Figure 7. phb-2 Is Required for the Elimination of Paternal Mitochondria and Prevention of Heteroplasmy in C. elegans
(A) Paternal inactivation of phb-2 results in the persistence of the sperm mitochondria during embryonic development. Wild-type N2 males and fem-3(e2006) females were fed on indicated RNAi bacteria. Males were labeled with CMXRos (Red) before mating with unlabeled females. F1 embryos were stained with DAPI (Blue) and examined in various stages. Projections of z stacked representative images are shown. Dotted lines indicate the outline of the embryos. Red signals outside the embryos are unfertilized sperm. p, paternal nuclear; m, maternal nuclear. Scale bars, 10 μm. (B) Quantitative analysis of sperm-derived CMXRos signals (paternal mitochondria) in F1 embryos at 64- to 100-cell stage (mean ± SEM; **p < 0.01; one-way ANOVA with the Sidak test). (C) Sperm-derived phb-2 is required to prevent paternal mtDNA transmission to F1 offspring. uaDf5/+ males and fem-3(e2006) females treated with the indicated RNAi bacteria were mated, and at least 30 L1 progeny were genotyped by PCR using wild-type or uaDf5 mtDNA-specific primers. Parental strains were included as controls. Similar results were observed in three independent experiments.

Comment in

Similar articles

Cited by

References

    1. Al Rawi S, Louvet-Vallée S, Djeddi A, Sachse M, Culetto E, Hajjar C, Boyd L, Legouis R, Galy V. Postfertilization autophagy of sperm organelles prevents paternal mitochondrial DNA transmission. Science. 2011;334:1144–1147. - PubMed
    1. Artal-Sanz M, Tavernarakis N. Prohibitin and mitochondrial biology. Trends Endocrinol Metab. 2009;20:394–401. - PubMed
    1. Back JW, Sanz MA, De Jong L, De Koning LJ, Nijtmans LG, De Koster CG, Grivell LA, Van Der Spek H, Muijsers AO. A structure for the yeast prohibitin complex: Structure prediction and evidence from chemical crosslinking and mass spectrometry. Protein Sci. 2002;11:2471–2478. - PMC - PubMed
    1. Bingol B, Sheng M. Mechanisms of mitophagy: PINK1, Parkin, USP30 and beyond. Free Radic Biol Med. 2016;S0891:30033–30038. - PubMed
    1. Bingol B, Tea JS, Phu L, Reichelt M, Bakalarski CE, Song Q, Foreman O, Kirkpatrick DS, Sheng M. The mitochondrial deubiquitinase USP30 opposes parkin-mediated mitophagy. Nature. 2014;510:370–375. - PubMed

MeSH terms

  NODES
INTERN 6
Note 2
Project 1
twitter 2