Pituitary adenylate cyclase-activating polypeptide (PACAP) has a neuroprotective function in dopamine-based neurodegeneration in rat and snail parkinsonian models
- PMID: 28067625
- PMCID: PMC5312006
- DOI: 10.1242/dmm.027185
Pituitary adenylate cyclase-activating polypeptide (PACAP) has a neuroprotective function in dopamine-based neurodegeneration in rat and snail parkinsonian models
Abstract
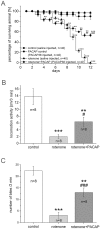
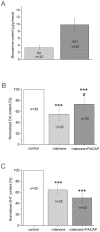
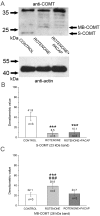
Pituitary adenylate cyclase-activating polypeptide (PACAP) rescues dopaminergic neurons from neurodegeneration and improves motor changes induced by 6-hydroxy-dopamine (6-OHDA) in rat parkinsonian models. Recently, we investigated the molecular background of the neuroprotective effect of PACAP in dopamine (DA)-based neurodegeneration using rotenone-induced snail and 6-OHDA-induced rat models of Parkinson's disease. Behavioural activity, monoamine (DA and serotonin), metabolic enzyme (S-COMT, MB-COMT and MAO-B) and PARK7 protein concentrations were measured before and after PACAP treatment in both models. Locomotion and feeding activity were decreased in rotenone-treated snails, which corresponded well to findings obtained in 6-OHDA-induced rat experiments. PACAP was able to prevent the behavioural malfunctions caused by the toxins. Monoamine levels decreased in both models and the decreased DA level induced by toxins was attenuated by ∼50% in the PACAP-treated animals. In contrast, PACAP had no effect on the decreased serotonin (5HT) levels. S-COMT metabolic enzyme was also reduced but a protective effect of PACAP was not observed in either of the models. Following toxin treatment, a significant increase in MB-COMT was observed in both models and was restored to normal levels by PACAP. A decrease in PARK7 was also observed in both toxin-induced models; however, PACAP had a beneficial effect only on 6-OHDA-treated animals. The neuroprotective effect of PACAP in different animal models of Parkinson's disease is thus well correlated with neurotransmitter, enzyme and protein levels. The models successfully mimic several, but not all etiological properties of the disease, allowing us to study the mechanisms of neurodegeneration as well as testing new drugs. The rotenone and 6-OHDA rat and snail in vivo parkinsonian models offer an alternative method for investigation of the molecular mechanisms of neuroprotective agents, including PACAP.
Keywords: 6-OHDA; DJ-1; Dopamine; PACAP; PARK7; PD models; Rotenone.
© 2017. Published by The Company of Biologists Ltd.
Conflict of interest statement
The authors declare no competing or financial interests.
Figures


Similar articles
-
Protection against dopaminergic neurodegeneration in Parkinson's disease-model animals by a modulator of the oxidized form of DJ-1, a wild-type of familial Parkinson's disease-linked PARK7.J Pharmacol Sci. 2011;117(3):189-203. doi: 10.1254/jphs.11151fp. Epub 2011 Oct 29. J Pharmacol Sci. 2011. PMID: 22041943
-
Pituitary adenylate cyclase activating polypeptide protects dopaminergic neurons and improves behavioral deficits in a rat model of Parkinson's disease.Behav Brain Res. 2004 May 5;151(1-2):303-12. doi: 10.1016/j.bbr.2003.09.007. Behav Brain Res. 2004. PMID: 15084446
-
Characterizations of a synthetic pituitary adenylate cyclase-activating polypeptide analog displaying potent neuroprotective activity and reduced in vivo cardiovascular side effects in a Parkinson's disease model.Neuropharmacology. 2016 Sep;108:440-50. doi: 10.1016/j.neuropharm.2015.05.014. Epub 2015 May 22. Neuropharmacology. 2016. PMID: 26006268
-
Protective effects of pituitary adenylate cyclase activating polypeptide against neurotoxic agents.Neurotoxicology. 2018 May;66:185-194. doi: 10.1016/j.neuro.2018.03.010. Epub 2018 Mar 28. Neurotoxicology. 2018. PMID: 29604313 Review.
-
Therapeutic potential of PACAP for neurodegenerative diseases.Cell Mol Biol Lett. 2015 Jun;20(2):265-78. doi: 10.1515/cmble-2015-0008. Cell Mol Biol Lett. 2015. PMID: 26204407 Review.
Cited by
-
Physical Activity Protects the Pathological Alterations of Alzheimer's Disease Kidneys via the Activation of PACAP and BMP Signaling Pathways.Front Cell Neurosci. 2020 Aug 14;14:243. doi: 10.3389/fncel.2020.00243. eCollection 2020. Front Cell Neurosci. 2020. PMID: 32922265 Free PMC article.
-
The neuropeptide PACAP alleviates T. gondii infection-induced neuroinflammation and neuronal impairment.J Neuroinflammation. 2022 Nov 19;19(1):274. doi: 10.1186/s12974-022-02639-z. J Neuroinflammation. 2022. PMID: 36403002 Free PMC article.
-
Downregulation of PACAP and the PAC1 Receptor in the Basal Ganglia, Substantia Nigra and Centrally Projecting Edinger-Westphal Nucleus in the Rotenone model of Parkinson's Disease.Int J Mol Sci. 2023 Jul 24;24(14):11843. doi: 10.3390/ijms241411843. Int J Mol Sci. 2023. PMID: 37511603 Free PMC article.
-
The PACAP Paradox: Dynamic and Surprisingly Pleiotropic Actions in the Central Regulation of Energy Homeostasis.Front Endocrinol (Lausanne). 2022 Jun 1;13:877647. doi: 10.3389/fendo.2022.877647. eCollection 2022. Front Endocrinol (Lausanne). 2022. PMID: 35721722 Free PMC article. Review.
-
The Neuroprotective and Biomarker Potential of PACAP in Human Traumatic Brain Injury.Int J Mol Sci. 2020 Jan 28;21(3):827. doi: 10.3390/ijms21030827. Int J Mol Sci. 2020. PMID: 32012887 Free PMC article. Review.
References
-
- Balog G., Voronezhskaya E. E., Hiripi L. and Elekes K. (2012). Organization of the serotonergic innervation of the feeding (buccal) musculature during the maturation of the pond snail Lymnaea stagnalis: a morphological and biochemical study. J. Comp. Neurol. 520, 315-329. 10.1002/cne.22693 - DOI - PubMed
Publication types
MeSH terms
Substances
LinkOut - more resources
Full Text Sources
Other Literature Sources
Medical
Research Materials
Miscellaneous

