Dynamic Reconfiguration of Visuomotor-Related Functional Connectivity Networks
- PMID: 28123020
- PMCID: PMC6597020
- DOI: 10.1523/JNEUROSCI.1672-16.2016
Dynamic Reconfiguration of Visuomotor-Related Functional Connectivity Networks
Abstract
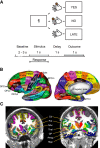
Cognitive functions arise from the coordination of large-scale brain networks. However, the principles governing interareal functional connectivity dynamics (FCD) remain elusive. Here, we tested the hypothesis that human executive functions arise from the dynamic interplay of multiple networks. To do so, we investigated FCD mediating a key executing function, known as arbitrary visuomotor mapping, using brain connectivity analyses of high-gamma activity recorded using MEG and intracranial EEG. Visuomotor mapping was found to arise from the dynamic interplay of three partly overlapping cortico-cortical and cortico-subcortical functional connectivity (FC) networks. First, visual and parietal regions coordinated with sensorimotor and premotor areas. Second, the dorsal frontoparietal circuit together with the sensorimotor and associative frontostriatal networks took the lead. Finally, cortico-cortical interhemispheric coordination among bilateral sensorimotor regions coupled with the left frontoparietal network and visual areas. We suggest that these networks reflect the processing of visual information, the emergence of visuomotor plans, and the processing of somatosensory reafference or action's outcomes, respectively. We thus demonstrated that visuomotor integration resides in the dynamic reconfiguration of multiple cortico-cortical and cortico-subcortical FC networks. More generally, we showed that visuomotor-related FC is nonstationary and displays switching dynamics and areal flexibility over timescales relevant for task performance. In addition, visuomotor-related FC is characterized by sparse connectivity with density <10%. To conclude, our results elucidate the relation between dynamic network reconfiguration and executive functions over short timescales and provide a candidate entry point toward a better understanding of cognitive architectures.
Significance statement: Executive functions are supported by the dynamic coordination of neural activity over large-scale networks. The properties of large-scale brain coordination processes, however, remain unclear. Using tools combining MEG and intracranial EEG with brain connectivity analyses, we provide evidence that visuomotor behaviors, a hallmark of executive functions, are mediated by the interplay of multiple and spatially overlapping subnetworks. These subnetworks span visuomotor-related areas, the cortico-cortical and cortico-subcortical interactions of which evolve rapidly and reconfigure over timescales relevant for behavior. Visuomotor-related functional connectivity dynamics are characterized by sparse connections, nonstationarity, switching dynamics, and areal flexibility. We suggest that these properties represent key aspects of large-scale functional networks and cognitive architectures.
Keywords: MEG; SEEG; dynamic reconfiguration; executive functions; functional connectivity dynamics; high-gamma activity.
Copyright © 2017 the authors 0270-6474/17/370840-15$15.00/0.
Figures


Similar articles
-
Characterization of Cortical Networks and Corticocortical Functional Connectivity Mediating Arbitrary Visuomotor Mapping.J Neurosci. 2015 Sep 16;35(37):12643-58. doi: 10.1523/JNEUROSCI.4892-14.2015. J Neurosci. 2015. PMID: 26377456 Free PMC article.
-
Inferior frontal gyrus links visual and motor cortices during a visuomotor precision grip force task.Brain Res. 2016 Nov 1;1650:252-266. doi: 10.1016/j.brainres.2016.09.011. Epub 2016 Sep 15. Brain Res. 2016. PMID: 27641995
-
Local Immediate versus Long-Range Delayed Changes in Functional Connectivity Following rTMS on the Visual Attention Network.Brain Stimul. 2017 Mar-Apr;10(2):263-269. doi: 10.1016/j.brs.2016.10.009. Epub 2016 Oct 19. Brain Stimul. 2017. PMID: 27838275 Free PMC article.
-
Integrated technology for evaluation of brain function and neural plasticity.Phys Med Rehabil Clin N Am. 2004 Feb;15(1):263-306. doi: 10.1016/s1047-9651(03)00124-4. Phys Med Rehabil Clin N Am. 2004. PMID: 15029909 Review.
-
Visuomotor transformations: early cortical mechanisms of reaching.Curr Opin Neurobiol. 1998 Dec;8(6):753-61. doi: 10.1016/s0959-4388(98)80118-9. Curr Opin Neurobiol. 1998. PMID: 9914239 Review.
Cited by
-
Towards New Diagnostic Approaches in Disorders of Consciousness: A Proof of Concept Study on the Promising Use of Imagery Visuomotor Task.Brain Sci. 2020 Oct 17;10(10):746. doi: 10.3390/brainsci10100746. Brain Sci. 2020. PMID: 33080823 Free PMC article.
-
Reduced resting-state brain functional network connectivity and poor regional homogeneity in patients with CADASIL.J Headache Pain. 2019 Nov 11;20(1):103. doi: 10.1186/s10194-019-1052-6. J Headache Pain. 2019. PMID: 31711415 Free PMC article.
-
Communication dynamics in complex brain networks.Nat Rev Neurosci. 2017 Dec 14;19(1):17-33. doi: 10.1038/nrn.2017.149. Nat Rev Neurosci. 2017. PMID: 29238085 Review.
-
Neural interactions in the human frontal cortex dissociate reward and punishment learning.Elife. 2024 Jun 28;12:RP92938. doi: 10.7554/eLife.92938. Elife. 2024. PMID: 38941238 Free PMC article.
-
Alterations in the Structural and Functional Connectivity of the Visuomotor Network of Children With Periventricular Leukomalacia.Semin Pediatr Neurol. 2019 Oct;31:48-56. doi: 10.1016/j.spen.2019.05.009. Epub 2019 May 15. Semin Pediatr Neurol. 2019. PMID: 31548024 Free PMC article.
References
-
- Alegre M, Alonso-Frech F, Rodríguez-Oroz MC, Guridi J, Zamarbide I, Valencia M, Manrique M, Obeso JA, Artieda J. Movement-related changes in oscillatory activity in the human subthalamic nucleus: ipsilateral vs. contralateral movements. Eur J Neurosci. 2005;22:2315–2324. - PubMed
Publication types
MeSH terms
LinkOut - more resources
Full Text Sources
Other Literature Sources
