. 2017 Mar 6;214(3):623-637.
doi: 10.1084/jem.20161525. Epub 2017 Feb 1.

EXTL3 mutations cause skeletal dysplasia, immune deficiency, and developmental delay

Affiliations

EXTL3 mutations cause skeletal dysplasia, immune deficiency, and developmental delay

Stefano Volpi et al. J Exp Med. .

Abstract

We studied three patients with severe skeletal dysplasia, T cell immunodeficiency, and developmental delay. Whole-exome sequencing revealed homozygous missense mutations affecting exostosin-like 3 (EXTL3), a glycosyltransferase involved in heparan sulfate (HS) biosynthesis. Patient-derived fibroblasts showed abnormal HS composition and altered fibroblast growth factor 2 signaling, which was rescued by overexpression of wild-type EXTL3 cDNA. Interleukin-2-mediated STAT5 phosphorylation in patients' lymphocytes was markedly reduced. Interbreeding of the extl3-mutant zebrafish (box) with Tg(rag2:green fluorescent protein) transgenic zebrafish revealed defective thymopoiesis, which was rescued by injection of wild-type human EXTL3 RNA. _targeted differentiation of patient-derived induced pluripotent stem cells showed a reduced expansion of lymphohematopoietic progenitor cells and defects of thymic epithelial progenitor cell differentiation. These data identify EXTL3 mutations as a novel cause of severe immune deficiency with skeletal dysplasia and developmental delay and underline a crucial role of HS in thymopoiesis and skeletal and brain development.


Figures

Figure 1.
Figure 1.
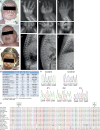
Clinical and immunological phenotype and mutation analysis. (A–C) Clinical image of P1 (showing exfoliative erythroderma) at 9 mo of age (A), cloverleaf skull and bulging fontanelle in P2 at age 2 mo (B), and P3 at age 2 yr and 6 mo showing a moderately bulging forehead and sunken nasal root with full cheeks (C). (D–L) Radiographs show short metacarpals and phalanges, open iliac wings, narrow sacro-ischiatic notches, radiolucent band at proximal femurs reminiscent of achondroplasia, and severe diffuse platyspondyly with expanded intervertebral spaces. In the pelvis of P3, there is coxa valga with delayed ossification of femoral heads, acetabular dysplasia, and hip subluxation. (D–F) P1; (G–I) P2; (J–L) P3. All radiographs were taken at birth, except for the pelvis of P3 (K), which was taken at 2 yr and 5 mo. (M) Laboratory data at diagnosis. ALC, absolute lymphocyte count. (N) Chromatograms demonstrating homozygosity for EXTL3 mutations in the affected patients. (O) Evolutionary conservation of the EXTL3 protein in the region containing the mutations detected in patients.
Figure 2.
Figure 2.
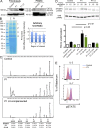
EXTL3 mutations affect HS composition and cell signaling. (A, left) Western blot analysis of EXTL3 protein expression in fibroblasts from a control and P1 and in P1’s fibroblasts complemented with a lentiviral vector–expressing wild-type EXTL3 (P1 LV). (Right) Western blot analysis of EXTL3 protein expression in PBMCs from a control and P3. β-actin was used as a loading control. Shown is a representative image of n = 3 experiments. (B, left) Alcian blue staining of HS length in EBV-B cell lines from control (C) and P1, as assessed by 5–12% SDS-PAGE. (Right) Relative quantification of content of HS’s of various length (defined by regions of interest; boxes on the left) in P1 versus control. Shown is the mean ± SD from one representative experiment of two. (C) Disaccharide composition analysis of HS chains, showing an increase in 6-O–sulfated and 2-O–sulfated disaccharides (peaks 4 and 5) in P1 cells, which was corrected by complementation with P1 LV. Shown are representative images of n = 2 experiments. (D, top) Western blot analysis of ERK phosphorylation (p44/42) at 0, 15, and 30 min after FGF2 stimulation of control, P1, and P1 LV fibroblasts. Shown is a representative image from three (P1 LV) and five (control and P1) replicates. (Bottom) Relative quantification (RQ) of the ratio between phospho-p44/42 and total p44/42 signal in stimulated versus unstimulated conditions. Shown is the mean ± SD from the same experiments as in the top panel. Statistical significance was assessed with two-tail Student’s t tests. (E) Overlays of flow cytometry histograms of phospho-STAT5 (pSTAT5) signal in unstimulated (tinted) and cytokine-stimulated (solid) PBMCs from a healthy control and P3. Gating was on CD4+ cells. Shown is one representative experiment of two.
Figure 3.
Figure 3.
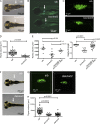
extl3/box-mutant zebrafish has defective thymopoiesis that is rescued by injection of EXTL3 wild-type RNA. (A) Extl3/box-mutant fish have shorter pectoral fins (arrows). (B) Immunofluorescence image of RAG2-GFP expression in 6–d postinfection (dpf) extl3/box Tg(rag2:gfp) larvae. Arrows indicate the thymus. (C and D) Representative images of isosurface 3D reconstruction (C) and total volume quantification (D) of thymic GFP signal from 6-dpf extl3/box Tg(rag2:gfp) larvae. (A–D) Shown are representative data of >50 sibling (sib) and 30 box animals from three independent experiments. (E) Rescue of thymic volume (left) and pectoral fin length (right) in 6-dpf extl3/box Tg(rag2:gfp) larvae injected with 100 ng EXTL3 wild-type RNA. Relative fin length indicates the ratio between lengths of fin to eye. n = 2 experiments. Error bars represent SEM. (F) Ext2/dak-mutant fish have shorter pectoral fins. (G and H) Representative images of isosurface 3D reconstruction (G) and total volume quantification (H) of thymic GFP signal from 6-dpf ext2/dak Tg(rag2:gfp) larvae. (F–H) Shown are representative images of >50 sibling, 30 box, and 27 dak animals from three independent experiments. Statistical significance was assessed using two-tail unpaired Student’s t test (D) and one-way ANOVA with Bonferroni post-analysis (E and H).
Figure 4.
Figure 4.
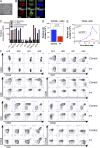
Altered HPC expansion from EXTL3 R339W iPSCs. (A and B) Morphological appearance (A) and immunofluorescence analysis (B) of P1’s iPSCs. Shown are results for one representative iPSC clone of three that were tested. (C) Quantitative real-time PCR analysis of expression of pluripotency markers in patient and control iPSCs versus parental fibroblasts. Shown are results from one representative experiment of three. (D) Count of HPCs formed during embryoid body differentiation. Shown are mean values ± SEM from two independent experiments with three different iPSC clones for both control and P1. (E) Cell count of lymphoid precursors at different time points of OP9-DL4 T cell differentiation assay. Represented are means of two experiments from three different iPSC clones. Error bars represent SEM. (F) Normal surface expression of CD4 and CD8 molecules at late stages of OP9-DL4 T cell differentiation assay. Representative figures of two experiments from three different iPSC clones are shown. Statistical significance was assessed using two-tail unpaired Student’s t test (D) or two-way ANOVA (E).
Figure 5.
Figure 5.
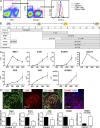
Altered TEP cell differentiation from EXTL3-mutant iPSCs. (A) Flow cytometric analysis of EXTL3 expression in total human thymic epithelial cell adhesion molecule (EpCam)+ TECs and CD45+ hematopoietic cells. FMO, fluorescence minus one. One representative experiment of two is shown. (B) Scheme of TEP differentiation protocol. (C) Gene expression profile during differentiation of control-derived iPSCs. (D) Immunofluorescence analysis of epithelial markers at TEP stage differentiation of control-derived iPSCs. (E) Differences in gene expression between control and P1 iPSC–derived TEPs. (C–E) Shown are representative results of at least three experiments, in each of which two different iPSC clones were tested for both P1 and healthy donor. Error bars represent SEM. iPS, iPSC; RA, retinoic acid; VPE, ventral pharyngeal endoderm. Statistical significance was assessed using two-tail unpaired Student’s t test.

Similar articles

Cited by

References

    1. Acquatella-Tran Van Ba I., Marchal S., François F., Silhol M., Lleres C., Michel B., Benyamin Y., Verdier J.M., Trousse F., and Marcilhac A.. 2012. Regenerating islet-derived 1α (Reg-1α) protein is new neuronal secreted factor that stimulates neurite outgrowth via exostosin Tumor-like 3 (EXTL3) receptor. J. Biol. Chem. 287:4726–4739. 10.1074/jbc.M111.260349 - DOI - PMC - PubMed
    1. Anderson G., and Jenkinson E.J.. 2001. Lymphostromal interactions in thymic development and function. Nat. Rev. Immunol. 1:31–40. 10.1038/35095500 - DOI - PubMed
    1. Bertrand J.Y., Chi N.C., Santoso B., Teng S., Stainier D.Y., and Traver D.. 2010. Haematopoietic stem cells derive directly from aortic endothelium during development. Nature. 464:108–111. 10.1038/nature08738 - DOI - PMC - PubMed
    1. Bitter T., and Muir H.M.. 1962. A modified uronic acid carbazole reaction. Anal. Biochem. 4:330–334. 10.1016/0003-2697(62)90095-7 - DOI - PubMed
    1. Bonafe L., Cormier-Daire V., Hall C., Lachman R., Mortier G., Mundlos S., Nishimura G., Sangiorgi L., Savarirayan R., Sillence D., et al. . 2015. Nosology and classification of genetic skeletal disorders: 2015 revision. Am. J. Med. Genet. A. 167:2869–2892. 10.1002/ajmg.a.37365 - DOI - PubMed

Publication types

Substances

  NODES
innovation 2
twitter 2