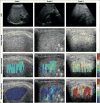
A Pilot Comparative Study of Quantitative Ultrasound, Conventional Ultrasound, and MRI for Predicting Histology-Determined Steatosis Grade in Adult Nonalcoholic Fatty Liver Disease
- PMID: 28267360
- PMCID: PMC5512552
- DOI: 10.2214/AJR.16.16726
A Pilot Comparative Study of Quantitative Ultrasound, Conventional Ultrasound, and MRI for Predicting Histology-Determined Steatosis Grade in Adult Nonalcoholic Fatty Liver Disease
Abstract
Objective: The purpose of this study is to explore the diagnostic performance of two investigational quantitative ultrasound (QUS) parameters, attenuation coefficient and backscatter coefficient, in comparison with conventional ultrasound (CUS) and MRI-estimated proton density fat fraction (PDFF) for predicting histology-confirmed steatosis grade in adults with nonalcoholic fatty liver disease (NAFLD).
Subjects and methods: In this prospectively designed pilot study, 61 adults with histology-confirmed NAFLD were enrolled from September 2012 to February 2014. Subjects underwent QUS, CUS, and MRI examinations within 100 days of clinical-care liver biopsy. QUS parameters (attenuation coefficient and backscatter coefficient) were estimated using a reference phantom technique by two analysts independently. Three-point ordinal CUS scores intended to predict steatosis grade (1, 2, or 3) were generated independently by two radiologists on the basis of QUS features. PDFF was estimated using an advanced chemical shift-based MRI technique. Using histologic examination as the reference standard, ROC analysis was performed. Optimal attenuation coefficient, backscatter coefficient, and PDFF cutoff thresholds were identified, and the accuracy of attenuation coefficient, backscatter coefficient, PDFF, and CUS to predict steatosis grade was determined. Interobserver agreement for attenuation coefficient, backscatter coefficient, and CUS was analyzed.
Results: CUS had 51.7% grading accuracy. The raw and cross-validated steatosis grading accuracies were 61.7% and 55.0%, respectively, for attenuation coefficient, 68.3% and 68.3% for backscatter coefficient, and 76.7% and 71.3% for MRI-estimated PDFF. Interobserver agreements were 53.3% for CUS (κ = 0.61), 90.0% for attenuation coefficient (κ = 0.87), and 71.7% for backscatter coefficient (κ = 0.82) (p < 0.0001 for all).
Conclusion: Preliminary observations suggest that QUS parameters may be more accurate and provide higher interobserver agreement than CUS for predicting hepatic steatosis grade in patients with NAFLD.
Keywords: attenuation; backscatter; grading accuracy; interobserver agreement; nonalcoholic fatty liver disease; nonalcoholic steatohepatitis; proton density fat fraction; quantitative imaging biomarkers; quantitative ultrasound.
Figures


Similar articles
-
Noninvasive Diagnosis of Nonalcoholic Fatty Liver Disease and Quantification of Liver Fat Using a New Quantitative Ultrasound Technique.Clin Gastroenterol Hepatol. 2015 Jul;13(7):1337-1345.e6. doi: 10.1016/j.cgh.2014.11.027. Epub 2014 Dec 3. Clin Gastroenterol Hepatol. 2015. PMID: 25478922 Free PMC article.
-
Novel Method for Ultrasound-Derived Fat Fraction Using an Integrated Phantom.J Ultrasound Med. 2020 Dec;39(12):2427-2438. doi: 10.1002/jum.15364. Epub 2020 Jun 11. J Ultrasound Med. 2020. PMID: 32525261
-
Agreement Between Magnetic Resonance Imaging Proton Density Fat Fraction Measurements and Pathologist-Assigned Steatosis Grades of Liver Biopsies From Adults With Nonalcoholic Steatohepatitis.Gastroenterology. 2017 Sep;153(3):753-761. doi: 10.1053/j.gastro.2017.06.005. Epub 2017 Jun 15. Gastroenterology. 2017. PMID: 28624576 Free PMC article. Clinical Trial.
-
Noninvasive monitoring of hepatic steatosis: controlled attenuation parameter and magnetic resonance imaging-proton density fat fraction in patients with nonalcoholic fatty liver disease.Expert Rev Gastroenterol Hepatol. 2019 Jun;13(6):523-530. doi: 10.1080/17474124.2019.1608820. Epub 2019 Apr 25. Expert Rev Gastroenterol Hepatol. 2019. PMID: 31018719 Review.
-
Quantitative Evaluation of Hepatic Steatosis Using Advanced Imaging Techniques: Focusing on New Quantitative Ultrasound Techniques.Korean J Radiol. 2022 Jan;23(1):13-29. doi: 10.3348/kjr.2021.0112. Korean J Radiol. 2022. PMID: 34983091 Free PMC article. Review.
Cited by
-
Quantitative ultrasound and machine learning for assessment of steatohepatitis in a rat model.Eur Radiol. 2019 May;29(5):2175-2184. doi: 10.1007/s00330-018-5915-z. Epub 2018 Dec 17. Eur Radiol. 2019. PMID: 30560362
-
Role of imaging-based biomarkers in NAFLD: Recent advances in clinical application and future research directions.J Hepatol. 2018 Feb;68(2):296-304. doi: 10.1016/j.jhep.2017.11.028. Epub 2017 Dec 2. J Hepatol. 2018. PMID: 29203392 Free PMC article. Review.
-
Quantitative ultrasound radiofrequency data analysis for the assessment of hepatic steatosis using the controlled attenuation parameter as a reference standard.Ultrasonography. 2021 Jan;40(1):136-146. doi: 10.14366/usg.20042. Epub 2020 May 9. Ultrasonography. 2021. PMID: 32654442 Free PMC article.
-
Nonalcoholic Fatty Liver Disease (NAFLD): Pathogenesis and Noninvasive Diagnosis.Biomedicines. 2021 Dec 22;10(1):15. doi: 10.3390/biomedicines10010015. Biomedicines. 2021. PMID: 35052690 Free PMC article. Review.
-
Protocol of quantitative ultrasound techniques for noninvasive assessing of hepatic steatosis after bariatric surgery.Front Surg. 2024 Jan 4;10:1244199. doi: 10.3389/fsurg.2023.1244199. eCollection 2023. Front Surg. 2024. PMID: 38239667 Free PMC article.
References
Publication types
MeSH terms
Grants and funding
LinkOut - more resources
Full Text Sources
Other Literature Sources
Medical

