. 2017 Apr 11;114(15):3909-3914.
doi: 10.1073/pnas.1614664114. Epub 2017 Mar 27.

ERRα induces H3K9 demethylation by LSD1 to promote cell invasion

Affiliations

ERRα induces H3K9 demethylation by LSD1 to promote cell invasion

Julie Carnesecchi et al. Proc Natl Acad Sci U S A. .

Abstract

Lysine Specific Demethylase 1 (LSD1) removes mono- and dimethyl groups from lysine 4 of histone H3 (H3K4) or H3K9, resulting in repressive or activating (respectively) transcriptional histone marks. The mechanisms that control the balance between these two antagonist activities are not understood. We here show that LSD1 and the orphan nuclear receptor estrogen-related receptor α (ERRα) display commonly activated genes. Transcriptional activation by LSD1 and ERRα involves H3K9 demethylation at the transcriptional start site (TSS). Strikingly, ERRα is sufficient to induce LSD1 to demethylate H3K9 in vitro. The relevance of this mechanism is highlighted by functional data. LSD1 and ERRα coregulate several _target genes involved in cell migration, including the MMP1 matrix metallo-protease, also activated through H3K9 demethylation at the TSS. Depletion of LSD1 or ERRα reduces the cellular capacity to invade the extracellular matrix, a phenomenon that is rescued by MMP1 reexpression. Altogether our results identify a regulatory network involving a direct switch in the biochemical activities of a histone demethylase, leading to increased cell invasion.

Keywords: ERRα; LSD1; cell migration; histone demethylation; transcriptional regulation.


Conflict of interest statement

The authors declare no conflict of interest.

Figures

Fig. 1.
Fig. 1.
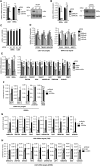
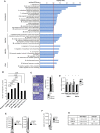
Common transcriptional _targets of ERRα and LSD1. (A) Heatmap of the 985 genes over- or underexpressed upon both siERRαs or both siLSD1s using log twofold changes (scale indicated). (B) Venn diagrams schematizing the number of genes modulated (up or down, Top) or activated (Bottom) by ERRα (pink) and/or LSD1 (blue). See Dataset S1 for complete gene lists. (C) Expression of the indicated genes analyzed by RT-qPCR after transfection with the indicated siRNA, relative to control conditions. Values are mean ± SEM of three independent experiments performed in triplicate. (D) ChIP experiments using anti-ERRα (Upper) and anti-LSD1 (Lower) antibody or IgG. Percent enrichments relative to input were measured by qPCR, amplifying a region encompassing the TSS for LSD1 or putative ERREs for ERRα. Bars represent mean ± SEM of three independent experiments performed in duplicate. Significance is shown relative to control conditions. *P < 0.05; **P < 0.01; ***P < 0.005; ns, nonsignificant.
Fig. S1.
Fig. S1.
Common transcriptional _targets of ERRα and LSD1. (A and B) Cells transfected with siRNAs directed against LSD1 (A) or ERRα (B) were analyzed for expression of the indicated genes by RT-qPCR (Left) or Western blots (Right). RT-qPCR results are presented relative to control conditions with bars representing mean ± SEM of three independent experiments performed in triplicate. hsp90 and actin were used as a loading control in Western blots. (C) Cell viability was determined 48 h after transfection with the indicated siRNAs. Data are expressed relative to control-transfected cells. Bars represent mean ± SEM of two independent experiments in triplicate. (D) Expression of the indicated genes after siERRα or siLSD1 transfection analyzed by RT-qPCR and presented relative to control conditions. Bars represent mean ± SEM of three independent experiments performed in triplicate. (E) Cells were transfected with siLSD1 or siERRα, alone or in combination. Expression of the indicated genes was analyzed by RT-qPCR and is presented relative to control conditions. Bars represent mean ± SEM of three independent experiments performed in triplicate. Significance is shown for individual siRNA (siLSD1 or siERRα) relative to combined siRNA (siLSD1 + siERRα). (F) Binding of ERRα on the ERREs of the indicated genes analyzed by ChIP followed by qPCR. Percent enrichment relative to input is shown using anti-ERRα or IgG as a control. Bindings of ERRα on a proximal (but not distal) element of its own promoter were used as positive and negative controls, respectively. (G) Binding of ERRα on the TSSs of the indicated genes analyzed by ChIP followed by qPCR. Percent enrichment relative to input is shown using anti-ERRα or IgG as a control. (H) Binding of LSD1 on the ERREs of the indicated genes analyzed by ChIP followed by qPCR. Percent enrichment relative to input is shown using anti-LSD1 or IgG as a control. *P < 0.05; **P < 0.01; ***P < 0.005; ns, nonsignificant.
Fig. S2.
Fig. S2.
Transcriptional _targets of LSD1 and ERRα in HEK293T cells. Expression of the indicated genes in HEK293T cells after siERRα or siLSD1 treatment analyzed by RT-qPCR and expressed relative to 36b4. Note that all studied genes respond to ERRα and LSD1 in a similar manner in HEK293T and MDA-MB231 cells with the exception of LEF1 (not regulated by either factor) and TMEM198, the expression of which was not detected in HEK293T cells. *P < 0.05; **P < 0.01; ***P < 0.005; ns, nonsignificant.
Fig. 2.
Fig. 2.
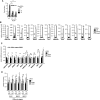
ERRα induces H3K9 demethylase activities of LSD1. ChIP experiments were performed using antibodies against H3K9me2, H3K4me2, or H3 on chromatin from MDA-MB231 cells treated with the indicated siRNAs (c, control siRNA). qPCRs were performed using primers specifically amplifying the TSSs of the indicated genes. Enrichments are shown relative to H3 and to control conditions. Bars represent the mean ± SEM of three independent experiments performed in duplicate. Significance is shown relative to control. *P < 0.05; ***P < 0.005; ns, nonsignificant.
Fig. S3.
Fig. S3.
ERRα transcriptional activity depends on LSD1 and controls for ChIP assays. (A) Cells inactivated for LSD1 (siLSD1#1 and #2) or not (siC) were transfected with ERRE-luciferase plasmid together with increasing amounts of ERRα-encoding plasmid. Results were normalized to samples transfected by ERRE-luciferase only. Bars show the mean ± SEM of three independent experiments performed in triplicate. (B) Detection of H3K4me2 and H3K9me2 at the TSSs of the indicated genes analyzed by ChIP. IgG was used as a control. Enrichments are presented relative to total H3 with bars representing mean ± SEM of three independent experiments performed in duplicate. (C) Detection of H3K9me2 at the ERREs of the indicated gene after siRNA-mediated inactivation of ERRα or LSD1. Results are expressed relative to control conditions with bars showing the mean of two independent experiments performed in triplicate. (D) Same as Fig. 2, analyzing the TSSs of the indicated genes. Significance is indicated relative to control conditions. *P < 0.05; ***P < 0.005; ns, nonsignificant.
Fig. 3.
Fig. 3.
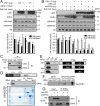
ERRα interacts with LSD1 and promotes H3K9 demethylase activity. (A and B) Bulk histones were incubated with recombinant LSD1 in demethylation buffer. Reactions were supplemented with ERRα translated in reticulocyte lysates (A) or recombinant ERRα protein (B). Unprogramed reticulocyte lysate (A) or BSA (B) was used as controls in the absence of ERRα. Levels of H3K4me2, H3K9me2, and H3 were analyzed by Western blot. Quantifications of histone marks were determined using ImageJ software and are expressed relative to H3 and to control conditions. Bars represent the mean ± SEM of four independent experiments. Significance is shown relative to control. *P < 0.05; **P < 0.01; ***P < 0.005. (C) Coimmunoprecipitation of endogenous proteins in MDA-MB231 cells with anti-LSD1 or anti-ERRα antibodies and rabbit IgG used as a control. IB, immunoblotting; IP, immunoprecipitation. (D) Pull-down assay using the indicated GST-fused LSD1 derivatives and nuclear extract from HeLa cells. FL, full-length; MAO, MonoAmine Oxidase domain; N-ter, N-terminal domain. Coomassie blue staining below shows the expression of GST-fused proteins used. (E) Pull-down experiment using GST-LSD1 (full-length) and nuclear extract from HeLa cells transfected with the indicated flag-tagged ERRα derivatives. (F) In vitro interaction assay using GST-LSD1 (full-length) and in vitro translated flagged ERRα or empty vector (pSG5). Western blots were probed with flag antibody. *, nonspecific band. (G) Recombinant LSD1 and recombinant ERRα were incubated in demethylation buffer. Immunoprecipitation was then performed using anti-ERRα antibody. Immunoblots (IBs) were probed with the indicated antibodies. Shown are 20% inputs.
Fig. S4.
Fig. S4.
Controls for demethylation and interaction assays. (A) Demethylation assay detecting H3K9me2 similar to Fig. 3A using the indicated flagged ERRα deletion mutants produced in reticulocyte lysates. ERRα mutants were detected in Western blot using flagM2 antibody. (B) In vitro demethylation assay with the same representation as Fig. 3A with supplementation by in vitro translated NRF1. (C) Control of the purity of recombinant ERRα (recERRα) used in Fig. 3B. Shown is a Coomassie blue staining of a gel loaded with the indicated amounts of recombinant ERRα or BSA used as a control. (D) Demethylation assay detecting H3K9me2 similar to Fig. 3A (for Left) and Fig. 3B (for Right) with supplementation of tranylcypromine (TCP), an LSD1 inhibitor. (E) Demethylation assay detecting H3K4me2 and H3K9me2, using recombinant LSD1 and ERRα (recHis6x-Trx-ERRα) purified from bacteria. Right shows a Coomassie blue staining of a gel loaded with the indicated amounts of recombinant ERRα and BSA used as a control. (F) Proximity ligation assays using anti-LSD1 and anti-ERRα antibodies under the indicated conditions. All quantifications represent the mean of three independent experiments.
Fig. 4.
Fig. 4.
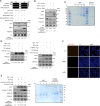
ERRα and LSD1 induce cell migration in an MMP1-dependent manner. (A) ERRα–LSD1 coregulated genes were analyzed by GO. Network of enriched GO terms obtained with REVIGO software after removing redundant terms is shown. Nodes represent GO terms that are gathered according to their semantic similarity. GO terms are coded by numbers (Fig. S4A for correspondence). Colors indicate the P value. (B) Expression of MMP1 analyzed by RT-qPCR after transfection with the indicated siRNAs, relative to control conditions. Values are mean ± SEM of three independent experiments performed in triplicate. Significance is shown relative to control. ***P < 0.005. (C) Expression of MMP1 protein analyzed by Western blot after treatment with the indicated siRNAs. (D) ChIP experiments performed using H3K9me2, H3K4me2, or H3 on chromatin from MDA-MB231 cells treated with the indicated siRNAs (c, control siRNA). qPCRs were performed using primers specifically amplifying the TSSs of the MMP1 gene. Enrichments are shown relative to H3 and to control conditions. Bars represent the mean ± SEM of three independent experiments performed in duplicate. Significance is shown relative to control. **P < 0.01; ***P < 0.005; ns, not significant. (E) Cells transfected with the indicated siRNAs supplemented or not with transfected MMP1 were allowed to invade Matrigel on Boyden chamber assays for 48 h. Microphotographs are displayed on Left. Quantifications were performed on whole well using ImageJ software. Bars represent the mean ± SEM of three independent experiments. ***P < 0.005.
Fig. S5.
Fig. S5.
ERRα and LSD1 induce cell migration in an MMP1-dependent manner. (A) Extended list of enriched GO terms in ERRα–LSD1 common _targets. Numbers correspond to the representation in Fig. 4A. –log10(P value) is indicated as enrichment level. Only enrichments >2 (red line) were considered significant. (B) Percentage of genes found under GO term cell migration (GO:0016477) in the whole genome (all genes) or within the genes modulated by LSD1 and/or ERRα, as indicated. Number of genes is displayed under parentheses. Significance is shown as P values above the bars. (C) Similar to Fig. 4E using cells treated with the indicated siRNAs. (D) Similar to Fig. 4B, analyzing the expression of MMP11 and MMP14 after treatment with the indicated siRNA. No variation (relative to control siRNA) was found significant. (E) Binding of ERRα or LSD1 on the indicated MMP1 promoter regions analyzed by ChIP. Percent enrichment is shown relative to input with IgG used as a control. Bars represent mean ± SEM of three independent experiments performed in duplicate. (F) Detection of H3K4me2 and H3K9me2 on the TSS of MMP1 gene. Conditions and representation are similar to Fig. S3B. (G) Expression of the indicated genes in MDA-MB231 or HEK293T cells determined by RT-qPCR is shown relative to that of the housekeeping gene 36b4 (values are in Ct of the indicated gene minus that of 36b4). Experiments were performed in triplicate. Values are mean ± SD. n.d., not detected. *P < 0.05; ***P < 0.005.
Fig. S6.
Fig. S6.
Features of LSD1–ERRα-repressed genes. (A) Similar to Fig. 1C, analyzing the expression of the LSD1–ERRα-repressed genes. (B) Similar to Fig. 2, analyzing histone marks at the TSS of the indicated genes. (C) Similar to Fig. 1C, analyzing the effect of siRNA-mediated NCoR1 inactivation on the indicated genes. Values are mean ± SEM (three independent experiments). Significance is shown relative to control conditions. *P < 0.05; **P < 0.01; ***P < 0.005; ns, nonsignificant.

Similar articles

Cited by

References

    1. Li B, Carey M, Workman JL. The role of chromatin during transcription. Cell. 2007;128(4):707–719. - PubMed
    1. Jenuwein T, Allis CD. Translating the histone code. Science. 2001;293(5532):1074–1080. - PubMed
    1. Rosenfeld MG, Lunyak VV, Glass CK. Sensors and signals: A coactivator/corepressor/epigenetic code for integrating signal-dependent programs of transcriptional response. Genes Dev. 2006;20(11):1405–1428. - PubMed
    1. Kouzarides T. Chromatin modifications and their function. Cell. 2007;128(4):693–705. - PubMed
    1. Shi Y, Whetstine JR. Dynamic regulation of histone lysine methylation by demethylases. Mol Cell. 2007;25(1):1–14. - PubMed

Publication types

LinkOut - more resources

  NODES
Note 1
Project 1
twitter 2