. 2017 Apr 20;544(7650):309-315.
doi: 10.1038/nature22040. Epub 2017 Apr 12.

Virus genomes reveal factors that spread and sustained the Ebola epidemic

Gytis Dudas  1   2 Luiz Max Carvalho  1 Trevor Bedford  2 Andrew J Tatem  3   4 Guy Baele  5 Nuno R Faria  6 Daniel J Park  7 Jason T Ladner  8 Armando Arias  9   10 Danny Asogun  11   12 Filip Bielejec  5 Sarah L Caddy  9 Matthew Cotten  13   14 Jonathan D'Ambrozio  8 Simon Dellicour  5 Antonino Di Caro  12   15 Joseph W Diclaro  16 Sophie Duraffour  12   17 Michael J Elmore  18 Lawrence S Fakoli  19 Ousmane Faye  20 Merle L Gilbert  8 Sahr M Gevao  21 Stephen Gire  7   22 Adrianne Gladden-Young  7 Andreas Gnirke  7 Augustine Goba  23   24 Donald S Grant  23   24 Bart L Haagmans  14 Julian A Hiscox  25   26 Umaru Jah  27 Jeffrey R Kugelman  8 Di Liu  28 Jia Lu  9 Christine M Malboeuf  7 Suzanne Mate  8 David A Matthews  29 Christian B Matranga  7 Luke W Meredith  9   27 James Qu  7 Joshua Quick  30 Suzan D Pas  14 My V T Phan  13   14 Georgios Pollakis  25 Chantal B Reusken  14 Mariano Sanchez-Lockhart  8   31 Stephen F Schaffner  7 John S Schieffelin  32 Rachel S Sealfon  7   33   34 Etienne Simon-Loriere  35   36 Saskia L Smits  14 Kilian Stoecker  12   37 Lucy Thorne  9 Ekaete Alice Tobin  11   12 Mohamed A Vandi  23   24 Simon J Watson  13 Kendra West  7 Shannon Whitmer  38 Michael R Wiley  8   31 Sarah M Winnicki  7   32 Shirlee Wohl  7   22 Roman Wölfel  12   37 Nathan L Yozwiak  7   22 Kristian G Andersen  39   40 Sylvia O Blyden  41 Fatorma Bolay  19 Miles W Carroll  12   18   26   42 Bernice Dahn  43 Boubacar Diallo  44 Pierre Formenty  45 Christophe Fraser  46 George F Gao  28   47 Robert F Garry  48 Ian Goodfellow  9   27 Stephan Günther  12   17 Christian T Happi  49   50 Edward C Holmes  51 Brima Kargbo  24 Sakoba Keïta  52 Paul Kellam  13   53 Marion P G Koopmans  14 Jens H Kuhn  54 Nicholas J Loman  30 N'Faly Magassouba  55 Dhamari Naidoo  45 Stuart T Nichol  38 Tolbert Nyenswah  43 Gustavo Palacios  8 Oliver G Pybus  6 Pardis C Sabeti  7   22 Amadou Sall  20 Ute Ströher  38 Isatta Wurie  21 Marc A Suchard  56   57   58 Philippe Lemey  5 Andrew Rambaut  1   59   60
Affiliations

Virus genomes reveal factors that spread and sustained the Ebola epidemic

Gytis Dudas et al. Nature. .

Abstract

The 2013-2016 West African epidemic caused by the Ebola virus was of unprecedented magnitude, duration and impact. Here we reconstruct the dispersal, proliferation and decline of Ebola virus throughout the region by analysing 1,610 Ebola virus genomes, which represent over 5% of the known cases. We test the association of geography, climate and demography with viral movement among administrative regions, inferring a classic 'gravity' model, with intense dispersal between larger and closer populations. Despite attenuation of international dispersal after border closures, cross-border transmission had already sown the seeds for an international epidemic, rendering these measures ineffective at curbing the epidemic. We address why the epidemic did not spread into neighbouring countries, showing that these countries were susceptible to substantial outbreaks but at lower risk of introductions. Finally, we reveal that this large epidemic was a heterogeneous and spatially dissociated collection of transmission clusters of varying size, duration and connectivity. These insights will help to inform interventions in future epidemics.


Conflict of interest statement

The authors declare no competing financial interests.

Figures

Figure 1
Figure 1. Distribution and correlation of EVD cases and EBOV sequences
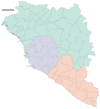
a) Administrative regions within Guinea (green), Sierra Leone (blue) and Liberia (red); shading is proportional to the cumulative number of known and suspected EVD cases in each region. Darkest shades represent 784 cases for Guinea (Macenta Prefecture), 3219 cases for Sierra Leone (Western Area Urban District) and 2925 cases for Liberia (Montserrado County); hatching indicate regions without reported EVD cases. Circle diameters are proportional to the number of EBOV genomes available from that region over the entire EVD epidemic with the largest representing 152 sequences. Crosses mark regions for which no sequences are available. Circles and crosses are positioned at population centroids within each region. b) A plot of number of EBOV genomes sampled against the known and suspected cumulative EVD case numbers. Regions in Guinea are denoted in green, Sierra Leone in blue and Liberia in red. Spearman correlation coefficient: 0.93.
Figure 2
Figure 2. Summary of early epidemic events
a) Temporal phylogeny of earliest sampled EBOV lineages in Guéckédou Prefecture, Guinea. 95% posterior densities of most recent common ancestor estimates for all lineages (grey) and lineages into Kailahun District, Sierra Leone (blue) and to Conakry Prefecture, Guinea (green) are shown at the bottom. Posterior probabilities > 0.5 are shown for lineages with >5 descendent sequences). b) Dispersal events marked by dashed lineages on the phylogeny projected on a map with directionality indicated by colour intensity (from white to red). Lineages that migrated to Conakry Prefecture and Kailahun District have led to the vast majority of EVD cases throughout the region.
Figure 3
Figure 3. Dispersal of virus lineages over time
Virus dispersal between administrative regions estimated under the GLM phylogeography model (see Supplementary Methods). The arcs are between population centroids of each region, show directionality from thin end to thick end and are coloured in a scale denoting time from December 2013 in blue to October 2015 in yellow. Countries are coloured with Liberia in red, Guinea in green and Sierra Leone in blue.
Figure 4
Figure 4. Transmission chains arising from independent international movements
a) EBOV lineages by country (Guinea, green; Sierra Leone, blue; Liberia, red), tracked until the sampling date of their last known descendants. Circles at the roots of each subtree denote the country of origin for the introduced lineage. b) Estimates of the change point probability (primary Y-axis) and log coefficient (mean and credible interval; secondary Y-axis) for the Nat/Int factor. Vertical lines represent dates of border closures by the respective countries.
Figure 5
Figure 5. Inference of GLM predictors in a ‘real-time’ context
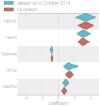
For the data set constructed from EBOV genome sequences derived from samples taken up until October 2014 (blue), the same 5 spatial EBOV movement predictors were given categorical support (inclusion probabilities = 1.0) as for the full data set (red). Likewise, the coefficients for these predictors are consistent in their sign and magnitude.
Figure 6
Figure 6. The effect of borders on EBOV migration rates between regions
Posterior densities of the migration rates between locations that share a geographical border (left) and those that do not (right) for international migrations and national migrations. Where two regions share a border, national migrations are only marginally more frequent than international migrations showing that both types of borders are porous to short local movement. Where the two regions are not adjacent, international migrations are much rarer than national migrations.
Figure 7
Figure 7. Summarized epidemic international migration history
All viral movement events between countries (Guinea, green; Sierra Leone, blue; Liberia, red) are shown split by whether they are between a) geographically distant regions or b) regions that share the international border. Curved lines indicate median (intermediate colour intensity), and 95% highest posterior density intervals (lightest and darkest colour intensities) for the number of migrations that are inferred to have taken place between countries.
Figure 8
Figure 8. Predicted destinations and consequences of viral dispersal
a) Predicted number of EBOV imports into each of 63 regions in Guinea, Sierra Leone and Liberia (including 7 without recorded cases in Guinea) and the surrounding 18 regions of the neighbouring countries of Guinea-Bissau, Senegal, Mali and Côte d’Ivoire. The expected number of EBOV exports from locations in the phylogeographic tree and imports to any location were calculated based on the phylogeographic GLM model estimates and associated predictors that were extended to apparently EVD-free locations (see Methods). b) Predicted EVD cluster sizes from the generalized linear model fitted to case data.
Figure 9
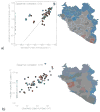
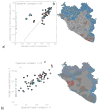
Figure 9. Comparison of predicted and observed numbers of introductions (a) and case numbers (b)
Scatter plots on the left of both panels show inferred introduction numbers (a) or observed case numbers (b), coloured by region as in Figure 4. Administrative regions not reporting any cases are indicated with empty circles on the scatter plot. Administrative regions in the map on the right side of both panels are coloured by the residuals (as observed/predicted) of the scatter plot. Regions are coloured grey where 0.5
Figure 10
Figure 10. Region specific introductions, cluster sizes and persistence
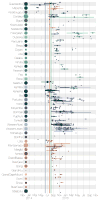
Each row summarises independent introductions and the sizes (as numbers of sequences) of resulting outbreak clusters. Clusters are coloured by their inferred region of origin (colours same as Figure 4). The horizontal lines represent the persistence of each cluster from the time of introduction to the last sampled case (individual tips have persistence 0). The areas of the circles in the middle of the lines are proportional to the number of sequenced cases in the cluster. The areas of the circles next to the labels on the left represent the population sizes of each administrative region. Vertical lines within each cell indicate the dates of declared border closures by each of the three countries: 11 June 2014 in Sierra Leone (blue), 27 July 2014 in Liberia (red), and 09 August 2014 in Guinea (green).
Figure 11
Figure 11. The metapopulation structure of the epidemic
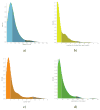
a) Kernel density estimate (KDE) of distance for all inferred EBOV dispersals events: 50% occur over distances <72 km and <5% occur over distances >232 km. b) KDE of the number of independent EBOV introductions into each administrative region: 50% have fewer than 4.8 and <5% greater than 21.3. c) KDE of the mean size of sampled cases resulting from each introduction with at least 2 sampled cases: 50% < 5.3, 95% <32. d) KDE of the persistence of clusters in days (from time of introduction to time of the last sampled case): 50% < 36 days, 95% < 181 days.
Figure 12
Figure 12
Kernel density estimates for inferred epidemiological statistics (from top to bottom): distance travelled (distance between population centroids, in kilometres), number of introductions that each location experienced, cluster size (number of sequences collected in a location as a result of a single introduction), cluster persistence (days from the common ancestor of a cluster to its last descendent, single tips have persistence of 0). Left hand side tracks these statistics for Sierra Leone (blue), Liberia (red) and Guinea (green), whilst the right hand side compares the statistics for before October 2014 (grey) and after (orange). Points with vertical lines connected to the x axis indicate the 50% and 95% quantiles of the parameter density estimates. Within Sierra Leone, Liberia and Guinea, 50% of all migrations occurred over distances of around 100km and persisted for around 25 days. Exceptions were Sierra Leone which experienced more introductions per location (around 12) than Guinea and Liberia (around 4) and Guinea, where migrations tended to occur over larger distances due to the size of the country and whose cluster sizes following introductions tended to be lower (3 sequences versus Liberia and Sierra Leone with 5 sequences each). Between the first (grey) and second (orange) years of the epidemic there were considerable reductions in cluster persistence, cluster sizes and distances travelled by viruses, whilst dispersal intensity remained largely the same.
Figure 13
Figure 13. Relationship of cluster size, introductions and persistence to population size
a) The mean number of introductions into each location against (log) population sizes. The Western Area (in Sierra Leone) received the most introductions, whilst Conakry (in Guinea) and Montserrado (in Liberia) were closer to the average. The association between population sizes and number of introductions was not very strong (R2 = 0.28, pearson correlation = 0.54, Spearman correlation = 0.57). b) The mean cluster size for each location plotted against (log) population sizes. The association here is weaker (R2 = 0.11, pearson correlation = 0.35, Spearman correlation = 0.57). c) The mean persistence times (per cluster, in days) against population sizes. A similarly weak association is observed (R2 = 0.12, pearson correlation = 0.37, Spearman correlation = 0.36). All computations based on a sample of 10,000 trees from the posterior distribution.

Similar articles

  • Phylodynamic assessment of intervention strategies for the West African Ebola virus outbreak.
    Dellicour S, Baele G, Dudas G, Faria NR, Pybus OG, Suchard MA, Rambaut A, Lemey P. Dellicour S, et al. Nat Commun. 2018 Jun 8;9(1):2222. doi: 10.1038/s41467-018-03763-2. Nat Commun. 2018. PMID: 29884821 Free PMC article.
  • The evolution of Ebola virus: Insights from the 2013-2016 epidemic.
    Holmes EC, Dudas G, Rambaut A, Andersen KG. Holmes EC, et al. Nature. 2016 Oct 13;538(7624):193-200. doi: 10.1038/nature19790. Nature. 2016. PMID: 27734858 Free PMC article. Review.
  • Genomic surveillance elucidates Ebola virus origin and transmission during the 2014 outbreak.
    Gire SK, Goba A, Andersen KG, Sealfon RS, Park DJ, Kanneh L, Jalloh S, Momoh M, Fullah M, Dudas G, Wohl S, Moses LM, Yozwiak NL, Winnicki S, Matranga CB, Malboeuf CM, Qu J, Gladden AD, Schaffner SF, Yang X, Jiang PP, Nekoui M, Colubri A, Coomber MR, Fonnie M, Moigboi A, Gbakie M, Kamara FK, Tucker V, Konuwa E, Saffa S, Sellu J, Jalloh AA, Kovoma A, Koninga J, Mustapha I, Kargbo K, Foday M, Yillah M, Kanneh F, Robert W, Massally JL, Chapman SB, Bochicchio J, Murphy C, Nusbaum C, Young S, Birren BW, Grant DS, Scheiffelin JS, Lander ES, Happi C, Gevao SM, Gnirke A, Rambaut A, Garry RF, Khan SH, Sabeti PC. Gire SK, et al. Science. 2014 Sep 12;345(6202):1369-72. doi: 10.1126/science.1259657. Epub 2014 Aug 28. Science. 2014. PMID: 25214632 Free PMC article.
  • Ebola Virus Epidemiology, Transmission, and Evolution during Seven Months in Sierra Leone.
    Park DJ, Dudas G, Wohl S, Goba A, Whitmer SL, Andersen KG, Sealfon RS, Ladner JT, Kugelman JR, Matranga CB, Winnicki SM, Qu J, Gire SK, Gladden-Young A, Jalloh S, Nosamiefan D, Yozwiak NL, Moses LM, Jiang PP, Lin AE, Schaffner SF, Bird B, Towner J, Mamoh M, Gbakie M, Kanneh L, Kargbo D, Massally JL, Kamara FK, Konuwa E, Sellu J, Jalloh AA, Mustapha I, Foday M, Yillah M, Erickson BR, Sealy T, Blau D, Paddock C, Brault A, Amman B, Basile J, Bearden S, Belser J, Bergeron E, Campbell S, Chakrabarti A, Dodd K, Flint M, Gibbons A, Goodman C, Klena J, McMullan L, Morgan L, Russell B, Salzer J, Sanchez A, Wang D, Jungreis I, Tomkins-Tinch C, Kislyuk A, Lin MF, Chapman S, MacInnis B, Matthews A, Bochicchio J, Hensley LE, Kuhn JH, Nusbaum C, Schieffelin JS, Birren BW, Forget M, Nichol ST, Palacios GF, Ndiaye D, Happi C, Gevao SM, Vandi MA, Kargbo B, Holmes EC, Bedford T, Gnirke A, Ströher U, Rambaut A, Garry RF, Sabeti PC. Park DJ, et al. Cell. 2015 Jun 18;161(7):1516-26. doi: 10.1016/j.cell.2015.06.007. Cell. 2015. PMID: 26091036 Free PMC article.
  • Learning from Ebola Virus: How to Prevent Future Epidemics.
    Kekulé AS. Kekulé AS. Viruses. 2015 Jul 9;7(7):3789-97. doi: 10.3390/v7072797. Viruses. 2015. PMID: 26184283 Free PMC article. Review.

Cited by

References

    1. World Health Organization. Ebola situation report - 10 june 2016. 2016 URL http://apps.who.int/iris/bitstream/10665/208883/1/ebolasitrep_10Jun2016_....
    1. Kuhn JH, et al. Nomenclature- and database-compatible names for the two ebola virus variants that emerged in guinea and the democratic republic of the congo in 2014. Viruses. 2014;6:4760–4799. URL http://dx.doi.org/10.3390/v6114760. - DOI - PMC - PubMed
    1. Baize S, et al. Emergence of zaire ebola virus disease in guinea. The New England Journal of Medicine. 2014;371:1418–1425. URL http://dx.doi.org/10.1056/NEJMoa1404505. - DOI - PubMed
    1. World Health Organization Regional Office for Africa. Ebola virus disease, west africa (situation as of 25 april 2014) 2014 URL http://www.afro.who.int/en/clusters-a-programmes/dpc/epidemic-a-pandemic....
    1. Goba A, et al. An outbreak of ebola virus disease in the lassa fever zone. The Journal of infectious diseases. 2016 URL http://dx.doi.org/10.1093/infdis/jiw239. - DOI - PMC - PubMed

Publication types

Grants and funding

  NODES
Association 4
HOME 2
Intern 18
iOS 9
Javascript 1
mac 2
Note 2
OOP 2
os 65
text 14
twitter 2
web 4