. 2017 May 9;114(19):5005-5010.
doi: 10.1073/pnas.1612177114. Epub 2017 Apr 24.

Endocannabinoid system acts as a regulator of immune homeostasis in the gut

Affiliations

Endocannabinoid system acts as a regulator of immune homeostasis in the gut

Nandini Acharya et al. Proc Natl Acad Sci U S A. .

Abstract

Endogenous cannabinoids (endocannabinoids) are small molecules biosynthesized from membrane glycerophospholipid. Anandamide (AEA) is an endogenous intestinal cannabinoid that controls appetite and energy balance by engagement of the enteric nervous system through cannabinoid receptors. Here, we uncover a role for AEA and its receptor, cannabinoid receptor 2 (CB2), in the regulation of immune tolerance in the gut and the pancreas. This work demonstrates a major immunological role for an endocannabinoid. The pungent molecule capsaicin (CP) has a similar effect as AEA; however, CP acts by engagement of the vanilloid receptor TRPV1, causing local production of AEA, which acts through CB2. We show that the engagement of the cannabinoid/vanilloid receptors augments the number and immune suppressive function of the regulatory CX3CR1hi macrophages (Mϕ), which express the highest levels of such receptors among the gut immune cells. Additionally, TRPV1-/- or CB2-/- mice have fewer CX3CR1hi Mϕ in the gut. Treatment of mice with CP also leads to differentiation of a regulatory subset of CD4+ cells, the Tr1 cells, in an IL-27-dependent manner in vitro and in vivo. In a functional demonstration, tolerance elicited by engagement of TRPV1 can be transferred to naïve nonobese diabetic (NOD) mice [model of type 1 diabetes (T1D)] by transfer of CD4+ T cells. Further, oral administration of AEA to NOD mice provides protection from T1D. Our study unveils a role for the endocannabinoid system in maintaining immune homeostasis in the gut/pancreas and reveals a conversation between the nervous and immune systems using distinct receptors.

Keywords: CX3CR1 macrophage; T-regulatory cells; cannabis; diabetes; mucosal immunity.


Conflict of interest statement

The authors declare no conflict of interest.

Figures
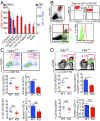
Fig. 1.
Fig. 1.
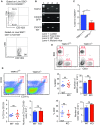
The ECS influences the siLP CX3CR1hi Mϕ at steady state. (A) Bar graph represents geometric mean fluorescence intensity (GMFI) of TRPV1 and CB2 on indicated siLP cells (asterisk and degree symbol represent statistical comparison of TRPV1 and CB2 expression, respectively, of each indicated cell type with expression of these receptors by CD11b+CX3CR1hi cells). (B) Phenotype of CD11b+CX3CR1hi cells (Top). Expression of IL-10 by CD11b+CX3CR1hi Mϕ (Q1, red) and CD11b+CX3CR1lo and CD11b+CX3CR1 cells (Q2, green; Bottom). (C) Representative FACS plots and column scatter plots represent the frequency (n = 7–8 mice per group), and bar graphs represent the absolute number (n = 5 mice per group) of CD11b+CX3CR1hi Mϕ (Middle) and CD11b+CX3CR1lo cells (Bottom) in the siLP of CX3CR1gfp/+ TRPV1+/+ and CX3CR1gfp/+ TRPV1−/− mice. (D) Representative FACS plots and column scatter plots represent the frequency, and bar graphs represent the absolute number of CD11b+CX3CR1hi Mϕ (Middle) and CD11b+CX3CR1lo cells (Bottom), in the siLP cells of CB2+/+ and CB2−/− mice (n = 5 mice per group). (ns, not significant; *P < 0.05, **P < 0.01, ***P < 0.001, and °°P < 0.01, unpaired Student’s t test; data represent mean ± SEM).
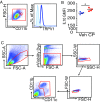
Fig. S1.
Fig. S1.
(A) Gating strategy for siLP cells of CX3CR1gfp/+ mice. SSChi and SSClo cells were gated. CD11b+SiglecF+ cells were analyzed in the SSChi population. SSClo cells were gated for CD3+ and B220+ cells and mononuclear phagocytes comprising R1 (CD11b+CD11c+) and R2 (CD11bCD11c+) cells. R1 and R2 were further analyzed for expression of CX3CR1 and/or CD103. (B) CX3CR1-antibody staining correlates with CX3CR1-GFP expression in CX3CR1gfp/+ mice. Dot plot represents three different populations shown by gates in distinct colors: CD11b+CX3CR1hi Mφ (red), CD11b+CX3CR1lo (green), and CD11b+CX3CR1 cells (blue) among live SSClo siLP cells of CX3CR1gfp/+ mice gated based on staining with CX3CR1 antibody (Left). Histograms represent expression of CX3CR1-GFP by each of the gated populations in distinct colors (Right), showing the correlation between CX3CR1 antibody staining and CX3CR1-GFP among live SSCloCD11b+ siLP cells of CX3CR1gfp/+. (C and D) Histogram with the normal serum (control) is shown in gray, and the histogram of expression of TRPV1 (C) or CB2 (D) by the selected population from A is shown in distinct colors. The number inside each box represents the GMFI, numbers in gray represent the GMFI of control, and the numbers in distinct colors represent GMFI of anti-TRPV1 or anti-CB2 antibody for the given population. (E) Total RNA was extracted from various immune cell populations sorted from siLP of mice, and expression levels of TRPV1 and CB2 (encoded by Cnr2) were evaluated by qPCR.
Fig. S2.
Fig. S2.
(A) Contour plot shows the expression of CD64 and CD103 by CD11b+CX3CR1lo cells (Top) and CD11c+CD103+ DCs (Bottom). (B) Genotype of the CX3CR1gfp/+TRPV1−/− mice constructed (C) siLP cells were purified from TRPV1+/+ and TRPV1−/− mice and were analyzed by flow cytometry by using antibody staining for CX3CR1. Bar graph represents the frequency of CX3CR1hi Mφ among live SSClo siLP cells of the TRPV1+/+ and TRPV1−/− mice. (D) Frequency and absolute number of CD11c+CD103+ DCs in the siLP of TRPV1+/+ and TRPV1−/− mice (n = 7–8 mice per group). (E) Frequency and absolute number of B220+ and CD3+ in the siLP of TRPV1+/+ and TRPV1−/− mice (n = 7–8 mice per group). (ns, not significant; n = 3; *P < 0.05, unpaired Student’s t test; data represent mean ± SEM).
Fig. 2.
Fig. 2.
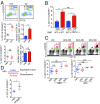
CP and AEA expand the CX3CR1hi Mϕ population in vivo. (A) CP-elicited changes (24 h after feeding) in the frequency (Middle and Bottom Left) and absolute numbers (Middle and Bottom Right) of CX3CR1hi Mϕ and CX3CR1lo cells in the siLP of CX3CR1gfp/+ mice (n = 4 mice per group). Veh, vehicle-treated mice. (B) TRPV1−/− mice (n = 4 mice per group) were lethally irradiated and, 24 h later, received CD45.1 C57BL/6 BM as described in Materials and Methods. After reconstitution (6 wk), TRPV1−/− BM chimeras were orally gavaged with CP or vehicle. Graph indicates CP-mediated changes in the frequency of CX3CR1hi Mϕ. (C) FACS plots and column scatter plots represent changes in the frequency (24 h after feeding) of siLP CX3CR1hi Mϕ elicited by AEA (data are pooled from three independent experiments testing different doses of AEA; n = 4–5 mice per group). (D) Changes in the frequency (24 h after feeding) of siLP CX3CR1hi Mϕ elicited by PF3845 (n = 4–5 mice per group). (ns, not significant; *P < 0.05, **P < 0.01, and ***P < 0.001, unpaired Student’s t test or one-way ANOVA; data represent mean ± SEM).
Fig. S3.
Fig. S3.
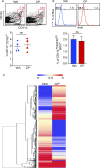
(A) Contour plots and column scatter plots represent frequency of CD11c+CD103+ DCs among live siLP cells 24 h after oral administration of CP (n = 4 mice per group). (B) Histogram and bar graph represent frequency of CX3CR1hi Mφ among live siLP cells that incorporated BrdU after oral administration of CP. (C) Hierarchical clustering heat map displaying the statistical overrepresentation of the top 1,200 up- or down-regulated DEGs in siLP MNPs after CP treatment (Left). (ns, not significant; data represent mean ± SEM).
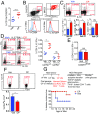
Fig. 3.
Fig. 3.
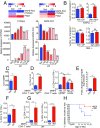
The relationship between CP, AEA, and the tolerogenic properties of siLP MNPs. (A) Heat map of RNA sequencing shows changes in enzymes involved in AEA biosynthesis after CP treatment in siLP MNPs (Top Left) and in RAW 264.7 cells (Top Right). Bar graph shows qPCR of enzymes involved in AEA biosynthesis in RAW 264.7 cells 2 h (Middle) and 4 h (Bottom) after CP treatment in vitro. (B) CP- or AEA-elicited changes (24 h after feeding) in the frequency of CX3CR1hi Mϕ in the siLP of TRPV1−/− mice (Top) and CB2−/− mice (Bottom; n = 4 mice per group). (C) CP-elicited changes in the expression (GMFI) of IL-10 (n = 4 mice per group). (DG) Mice underwent oral gavage with vehicle (Veh) or CP (10 μg) or AEA (500 μg), and siLP MNPs (CD11b+CD11c+ and CD11bCD11c+) were sorted after 24 h (D and G) and 48 h (E). (D) MNPs were sorted from CP-treated or vehicle-treated mice and cocultured (1:1) with naïve splenic CD4+CD25CD62L+ T cells derived from WT (IL-27RA+/+) or IL-27RA−/− mice for 4 d. Expression of IL-10 and IFN-γ among the CD4+ cells was analyzed by flow cytometry. Bar graphs represent the frequency of CD4+IL-10+ and CD4+IL-10+IFN-γ+ (Tr1) cells. (Data are representative of two independent experiments and show mean values ± SEM of duplicate or triplicate determinations in which MNPs were sorted from 12 pooled mice per group). (E) Total RNA was extracted from MNPs sorted from CP-treated or vehicle-treated mice, and expression levels of IL-27-p28 were evaluated by qPCR. (Data represent duplicate determinations from 12 pooled mice per group). Bar graph represents fold increase in expression of IL-27–p28 in CP-treated samples with respect to vehicle-treated samples. (F) Frequency of CP-elicited CD4+IL-10+IFN-γ+ (Tr1) cells among live SSClo siLP cells 2 wk after treatment (n = 4 mice per group). (G) MNPs were sorted from AEA-treated or vehicle-treated mice and cocultured with WT T cells as described in D. Bar graphs represent the frequency of CD4+IL-10+ and CD4+IL-10+IFN-γ+ (Tr1) cells. (Data show mean values ± SEM of triplicate determinations in which MNPs were sorted from 10 pooled mice per group.) (H) Female NOD mice were orally administered AEA or vehicle at 9th and 10th weeks of age, and urine glucose was monitored to study disease progression. (ns, not significant; *P < 0.05, **P < 0.01, ***P < 0.001, and ****P < 0.0001, unpaired Student’s t test; data represent mean ± SEM; Mantel–Cox test was used for survival curve).
Fig. S4.
Fig. S4.
(A) Histogram showing TRPV1 expression in RAW 264.7 cells. (B) IL-10–GFP reporter mice underwent oral gavage with vehicle or CP (10 μg). siLP cells were isolated after 24 h, and CP-elicited changes in IL-10 expression among siLP CD11c+CD103+ DCs were analyzed by flow cytometry. Column scatter graphs represent GMFI of IL-10 among siLP CD11c+CD103+ DCs (n = 4 mice per group). (C) Gating strategy for sorting siLP MNPs. siLP cells were harvested, and SSClo live cells were sorted on the basis of the expression of CD11b and CD11c after exclusion of doublets. (*P < 0.05, unpaired Student’s t test; data represent mean ± SEM).
Fig. 4.
Fig. 4.
Feeding CP enhances tolerance in PLN and mediates protection against T1D. (A) Frequency of PLN CD11b+CX3CR1+ cells of NOD mice 3 d after oral gavage with CP (10 μg; n = 8 mice per group). (B) Contour plot (Top Left) shows the gate for PLN CD11b+CX3CR1+ cells (red gate). Contour plot (Top Right) shows the expression of MHCII and CD11c on the gated cells. Left histogram shows the expression of CD64 (red) and isotype control (blue) by the gated cells; right histogram shows IL-10 expression by gated cells from IL-10–GFP reporter mouse (red) and C57BL/6 mouse with no GFP (blue). (C) Frequency of CP-elicited CD4+IL-10+IFN-γ+ (Tr1) cells, CD4+IL-10+ cells, and CD4+IFN-γ+ among live PLN cells of NOD mice (n = 4 mice per group). (D and E) Frequency of CP-elicited Tr1 cells among live PLN cells in (D) IL-27RA+/+ and IL-27RA−/− mice (n = 4 per group) and (E) CX3CR1gfp/gfp mice (n = 4 mice per group). (F) Frequency of CP-elicited CD4+IL-17A+ cells among live CD4+ PLN cells of NOD mice (n = 4 mice per group). (G) Schematic representation of the experimental design (Top). Survival curve represents difference in diabetes development between the two recipient groups (Bottom; n = 15 mice per group, P < 0.01). (ns, not significant; *P < 0.05, **P < 0.01, and ****P < 0.0001, unpaired Student’s t test or Mantel–Cox test; error bars indicate ± SEM).
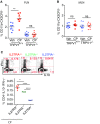
Fig. S5.
Fig. S5.
(A and B) Frequency of CD11b+CX3CR1+ cells among live FSChi cells of TPRV1+/+ or TRPV1−/− mice in the PLN (A) and MLN cells (B) 3 d after oral gavage with CP (10 μg; n = 7–9 mice per group). (C) Frequency of CP-elicited Tr1 cells among live PLN cells in IL-27RA+/+, IL-27RA−/− and IL-27RA+/− mice (n = 3–4 mice per group). (*P < 0.05 and ****P < 0.0001, unpaired Student’s t test; data represent mean ± SEM).

Similar articles

Cited by

References

    1. McPartland JM, Matias I, Di Marzo V, Glass M. Evolutionary origins of the endocannabinoid system. Gene. 2006;370:64–74. - PubMed
    1. Di Marzo V, Bifulco M, De Petrocellis L. The endocannabinoid system and its therapeutic exploitation. Nat Rev Drug Discov. 2004;3:771–784. - PubMed
    1. Schmid HH, Schmid PC, Natarajan V. N-acylated glycerophospholipids and their derivatives. Prog Lipid Res. 1990;29:1–43. - PubMed
    1. Schmid HH. Pathways and mechanisms of N-acylethanolamine biosynthesis: Can anandamide be generated selectively? Chem Phys Lipids. 2000;108:71–87. - PubMed
    1. Di Marzo V, Matias I. Endocannabinoid control of food intake and energy balance. Nat Neurosci. 2005;8:585–589. - PubMed

Publication types

  NODES
admin 4
twitter 2