Selective disruption of an oncogenic mutant allele by CRISPR/Cas9 induces efficient tumor regression
- PMID: 28575452
- PMCID: PMC5570104
- DOI: 10.1093/nar/gkx490
Selective disruption of an oncogenic mutant allele by CRISPR/Cas9 induces efficient tumor regression
Abstract
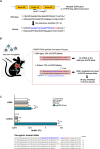
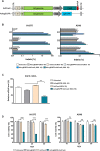
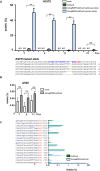
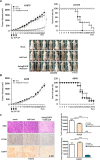
Approximately 15% of non-small cell lung cancer cases are associated with a mutation in the epidermal growth factor receptor (EGFR) gene, which plays a critical role in tumor progression. With the goal of treating mutated EGFR-mediated lung cancer, we demonstrate the use of clustered regularly interspaced short palindromic repeats (CRISPR)/CRISPR associated protein 9 (Cas9) system to discriminate between the oncogenic mutant and wild-type EGFR alleles and eliminate the carcinogenic mutant EGFR allele with high accuracy. We _targeted an EGFR oncogene harboring a single-nucleotide missense mutation (CTG > CGG) that generates a protospacer-adjacent motif sequence recognized by the CRISPR/Cas9 derived from Streptococcus pyogenes. Co-delivery of Cas9 and an EGFR mutation-specific single-guide RNA via adenovirus resulted in precise disruption at the oncogenic mutation site with high specificity. Furthermore, this CRISPR/Cas9-mediated mutant allele disruption led to significantly enhanced cancer cell killing and reduced tumor size in a xenograft mouse model of human lung cancer. Taken together, these results indicate that _targeting an oncogenic mutation using CRISPR/Cas9 offers a powerful surgical strategy to disrupt oncogenic mutations to treat cancers; similar strategies could be used to treat other mutation-associated diseases.
© The Author(s) 2017. Published by Oxford University Press on behalf of Nucleic Acids Research.
Figures


Similar articles
-
Selective _targeting of the oncogenic KRAS G12S mutant allele by CRISPR/Cas9 induces efficient tumor regression.Theranostics. 2020 Apr 6;10(11):5137-5153. doi: 10.7150/thno.42325. eCollection 2020. Theranostics. 2020. PMID: 32308773 Free PMC article.
-
Selective _targeting of KRAS oncogenic alleles by CRISPR/Cas9 inhibits proliferation of cancer cells.Sci Rep. 2018 Aug 8;8(1):11879. doi: 10.1038/s41598-018-30205-2. Sci Rep. 2018. PMID: 30089886 Free PMC article.
-
CRISPR-Barcoding for Intratumor Genetic Heterogeneity Modeling and Functional Analysis of Oncogenic Driver Mutations.Mol Cell. 2016 Aug 4;63(3):526-38. doi: 10.1016/j.molcel.2016.06.017. Epub 2016 Jul 21. Mol Cell. 2016. PMID: 27453044 Free PMC article.
-
The application of genome editing in studying hearing loss.Hear Res. 2015 Sep;327:102-8. doi: 10.1016/j.heares.2015.04.016. Epub 2015 May 15. Hear Res. 2015. PMID: 25987504 Free PMC article. Review.
-
CRISPR/Cas9: molecular tool for gene therapy to _target genome and epigenome in the treatment of lung cancer.Cancer Gene Ther. 2015 Nov;22(11):509-17. doi: 10.1038/cgt.2015.54. Epub 2015 Oct 23. Cancer Gene Ther. 2015. PMID: 26494554 Review.
Cited by
-
Recent Advances and Prospects of Nucleic Acid Therapeutics for Anti-Cancer Therapy.Molecules. 2024 Oct 7;29(19):4737. doi: 10.3390/molecules29194737. Molecules. 2024. PMID: 39407665 Free PMC article. Review.
-
Exploring Clustered Regularly Interspaced Short Palindromic Repeats-CRISPR-Associated Protein 9 (CRISPR-Cas9) as a Therapeutic Modality for Cancer: A Scoping Review.Cureus. 2024 Jul 11;16(7):e64324. doi: 10.7759/cureus.64324. eCollection 2024 Jul. Cureus. 2024. PMID: 39130943 Free PMC article. Review.
-
Advanced gene therapy system for the treatment of solid tumour: A review.Mater Today Bio. 2024 Jun 22;27:101138. doi: 10.1016/j.mtbio.2024.101138. eCollection 2024 Aug. Mater Today Bio. 2024. PMID: 39027677 Free PMC article. Review.
-
Application and perspective of CRISPR/Cas9 genome editing technology in human diseases modeling and gene therapy.Front Genet. 2024 Apr 11;15:1364742. doi: 10.3389/fgene.2024.1364742. eCollection 2024. Front Genet. 2024. PMID: 38666293 Free PMC article. Review.
-
CRISPR/Cas9 _targeting of passenger single nucleotide variants in haploinsufficient or essential genes expands cancer therapy prospects.Sci Rep. 2024 Mar 28;14(1):7436. doi: 10.1038/s41598-024-58094-8. Sci Rep. 2024. PMID: 38548901 Free PMC article.
References
-
- Siegel R.L., Miller K.D., Jemal A.. Cancer Statistics, 2017. CA Cancer J. Clin. 2017; 67:7–30. - PubMed
-
- Edwards B.K., Noone A.M., Mariotto A.B., Simard E.P., Boscoe F.P., Henley S.J., Jemal A., Cho H., Anderson R.N., Kohler B.A. et al. . Annual Report to the Nation on the status of cancer, 1975–2010, featuring prevalence of comorbidity and impact on survival among persons with lung, colorectal, breast, or prostate cancer. Cancer. 2014; 120:1290–1314. - PMC - PubMed
-
- Ohsaki Y., Tanno S., Fujita Y., Toyoshima E., Fujiuchi S., Nishigaki Y., Ishida S., Nagase A., Miyokawa N., Hirata S. et al. . Epidermal growth factor receptor expression correlates with poor prognosis in non-small cell lung cancer patients with p53 overexpression. Oncol. Rep. 2000; 7:603–607. - PubMed
-
- Inamura K., Ninomiya H., Ishikawa Y., Matsubara O.. Is the epidermal growth factor receptor status in lung cancers reflected in clinicopathologic features. Arch. Pathol. Lab. Med. 2010; 134:66–72. - PubMed
-
- Hynes N.E., Lane H.A.. ERBB receptors and cancer: the complexity of _targeted inhibitors. Nat. Rev. Cancer. 2005; 5:341–354. - PubMed
MeSH terms
Substances
LinkOut - more resources
Full Text Sources
Other Literature Sources
Medical
Research Materials
Miscellaneous

