. 2017 May 15;31(10):990-1006.
doi: 10.1101/gad.301036.117.

m6A mRNA modifications are deposited in nascent pre-mRNA and are not required for splicing but do specify cytoplasmic turnover

Affiliations

m6A mRNA modifications are deposited in nascent pre-mRNA and are not required for splicing but do specify cytoplasmic turnover

Shengdong Ke et al. Genes Dev. .

Abstract

Understanding the biologic role of N6-methyladenosine (m6A) RNA modifications in mRNA requires an understanding of when and where in the life of a pre-mRNA transcript the modifications are made. We found that HeLa cell chromatin-associated nascent pre-mRNA (CA-RNA) contains many unspliced introns and m6A in exons but very rarely in introns. The m6A methylation is essentially completed upon the release of mRNA into the nucleoplasm. Furthermore, the content and location of each m6A modification in steady-state cytoplasmic mRNA are largely indistinguishable from those in the newly synthesized CA-RNA or nucleoplasmic mRNA. This result suggests that quantitatively little methylation or demethylation occurs in cytoplasmic mRNA. In addition, only ∼10% of m6As in CA-RNA are within 50 nucleotides of 5' or 3' splice sites, and the vast majority of exons harboring m6A in wild-type mouse stem cells is spliced the same in cells lacking the major m6A methyltransferase Mettl3. Both HeLa and mouse embryonic stem cell mRNAs harboring m6As have shorter half-lives, and thousands of these mRNAs have increased half-lives (twofold or more) in Mettl3 knockout cells compared with wild type. In summary, m6A is added to exons before or soon after exon definition in nascent pre-mRNA, and while m6A is not required for most splicing, its addition in the nascent transcript is a determinant of cytoplasmic mRNA stability.

Keywords: cell fractionation; m6A-CLIP; mRNA turnover; pre-mRNA.


Figures

Figure 1.
Figure 1.
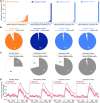
m6A modification occurs on chromatin (CA-RNA) in exons in nascent pre-mRNA. (A) Many exons are not yet spliced in CA-RNAs. Internal exons were obtained according to the gene structure annotation of GENCODE (version 19 of human hg19). PolyA+ RNAs were oligo dT-selected RNAs from total RNAs, and Ribo0 RNAs were total RNAs depleted of ribosome RNA by Ribo-Zero kit from Epicentre. (B) The great majority of m6As in pre-mRNA is in exons. Details of m6A peak calling are described in the Supplemental Material. In brief, for each m6A peak region, we enumerated reads of m6A immunoprecipitation and the input to evaluate the statistical significance (Fisher's exact test). Benjamini-Hochberg was implemented to adjust the P-value to the false discovery rate (FDR) for multiple testing. FDR <5%. (C) Chromatin pre-mRNAs that are partially spliced have more intronic RNA sequencing (RNA-seq) reads than exonic RNA-seq reads. (D) m6A peaks follow virtually the same distribution in RNAs from the three cell fractions. (Black line) mRNAs with a stop codon in last exon; (red line) mRNAs with a stop codon not in last exon; (gray and light-pink shaded regions) standard error of the mean (SEM). Not only is the distribution the same for m6A, but the m6A peak strength for each m6A also is mostly the same for each of the three cell fractions (see details in Fig. 2).
Figure 2.
Figure 2.
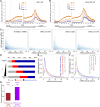
Each individual m6A modification is modified mostly with the same level for each of the three cell fractions. (A) Comparison of individual m6A peak signal strength in CA-RNA and nucleoplasmic RNA for the same m6A peaks (each dot is an individual m6A peak: no changes in gray, CA-RNA higher in orange, and nucleoplasm higher in dark blue). FDR <5%, Fisher's exact test. To determine m6A peaks that are higher in CA-RNA, for each m6A peak region, we enumerated reads of m6A immunoprecipitation and the input for CA-RNA and Nucleoplasm RNA, evaluating statistical significance with Fisher's exact test, using stringent FDR cutoffs to correct for multiple hypothesis testing. The determination that an m6A peak region was higher in CA-RNA required (1) the reads of mRNAs in m6A peak regions to be adequate for m6A peak region detection in both CA-RNA and nucleoplasmic mRNA (reads per kilobase per million mapped reads [RPKM] ≥1) and (2) FDR ≤0.05 and a twofold or higher of peak region enrichment in CA-RNA compared with nucleoplasmic mRNA. At a lower cutoff (e.g., ≥1.5-fold), the same conclusion held: that most m6A peaks are modified with the same level between CA-RNA and nucleoplasmic mRNA. (B) Comparison of individual m6A peak signal strength in nucleoplasmic RNA to cytoplasmic RNA for the same m6A peak. The same statistic criteria were used as in A. (Gray) No changes; (dark blue) nucleoplasm higher; (light blue) cytoplasm higher. FDR < 5%, Fisher's exact test. At a lower cutoff (e.g., ≥1.5-fold), again, the same conclusion held that most m6A peaks were modified at the same level in nucleoplasmic mRNA and cytoplasmic mRNA.
Figure 3.
Figure 3.
m6A can be added to exons before splicing. (A) Compared with input reads, m6A immunoprecipitation reads were enriched for pre-mRNA reads containing both intron and m6A-containing exon sequences (left) but depleted for exon–intron junction sequence fragments lacking m6A (right). (***) P < 10−100, Fisher's exact test. (B) An example of an internal exon in the PRR5 gene. “m6A-CLIP site” shows a precise m6A site (black box) identified by m6A-CLIP. “IP reads” lists the cDNA reads of RNA fragments that were precipitated by m6A-specific antibody and contain both the m6A site and the unspliced intronic region. This m6A site is near a 3′ splice site. (C) An internal exon in the TBX3 gene; this m6A site is near a 5′ splice site. More examples are in Supplemental Figure 5.
Figure 4.
Figure 4.
The majority of m6As is not located close to splice sites. (A) The density of m6A at increasing distances from 3′ or 5′ splice sites in CA-RNA (orange lines), the nucleoplasm (dark blue), and the cytoplasm (light blue). “Relative m6A peak density” for a fixed position from the splice site was calculated as the scaled m6A peak density at that position scaled proportional to the average m6A peak density in exonic regions >100 nt away from splice sites (black line). To clearly show the distribution of m6A peaks from the splice sites, we focused on internal exons with exon length at least 200 nt so that the 100-nt exon regions from the 5′ splice site (“SS”) and the 3′ splice site do not overlap. The internal exons 200 -nt long contain ∼80% of all internal exon m6As. The center exon is required to have m6A. Exon number = 3069. Error bar is the SEM. (B) Seven percent of exonic m6As are within 50 nt of splice sites for internal exons in A. (Top left panel) Few m6As locate close to splice sites. (Top right panel) More RRACUs locate close to splice sites. Total RRACU number is 5673 in the same exons. P < 1 × 10⁻²⁴, Fisher's exact test. (Bottom left panel) Long internal exons (≥200 nt, the internal exons in A) have 80% of total internal exon m6As, while short ones (<200 nt) have only the remaining 20%. (Bottom right panel) Long internal exons have only 28% of the total internal exon RRACU motifs (total RRACU number is 46,492 for total internal exons; P < 1 × 10−100, Fisher's exact test), in contrast to short ones that have the majority (72%). Even if we consider all m6A-containing internal exons (both long and short), still, only 20% of total internal exonic m6As are within 50 nt of splice sites. (C) The CA-RNA m6A peaks that are higher showed higher density in exonic regions near 5′ or 3′ splice sites. “CA-RNA higher” refers to the m6A peaks in Figure 2A with higher m6A signal strength in CA-RNA (orange). “No change” refers to the frequency of m6A peaks with no difference between CA-RNAs and nucleoplasm RNAs in Figure 2A (gray). Error bars are SEM. (D) The majority (>90%) of transcripts in which m6As are higher in CA-RNA than nucleoplasmic RNA is at least 50 nt away from splice sites. A minority of CA-RNA transcripts does have a percentage greater density of m6A near splice sites (≤50 nt; 9% vs. 6%), but the majority of these modifications does not persist in nuceloplasmic RNA (Fig. 2A). (E) Internal constitutive exons containing m6A show no change in splicing between wild-type and Mettl3 knockout mouse ESCs. Internal constitutive exons with m6A are defined as the triexon structure, with constitutive exon being the center exon; at least one of the three exons should have m6A. All 8601 m6A-containing internal constitutive exons showed the same degree of exon inclusion in Mettl3 knockout and wild-type cells (significant changes are defined as ΔPSI [percent spiced in] ≥0.1; FDR <5%) despite a decrease in m6A level in mRNAs to 10% of wild type (Fig. 6A; Supplemental Fig. 11). (F) A minority of internal alternative cassette exons with m6A (defined as the triexon structure, with alternative cassette exon being the center exon; at least one of the three exons should have m6A) shows splicing changes in Mettl3 knockout versus wild-type cells. Approximately 5% of all 1830 m6A-containing internal alternative cassette exons changed splicing in Mettl3 knockout cells (significant changes are defined as ΔPSI ≥0.1; FDR <5%). We also examined the splicing for all constitutive exons and alternative exons regardless of whether they contain m6A or not (i.e., even considering the indirect effects of m6A on splicing). Again, all 67,706 constitutive exons spliced identically, and only a very minor proportion (∼3%) of all 11,715 alternative cassette exons changed splicing. Other alternative splicing types showed even fewer changes, including alternative 5′ splice site, alternative 3′ splice site, and intron retention. We also analyzed the raw RNA-seq data of previous publications that reported certain splicing changes upon comprising Mettl3 expression levels (Supplemental Fig. 9; Dominissini et al. 2012; Zhao et al. 2014; Geula et al. 2015; Liu et al. 2015) and found the same result: that exons splice mostly the same when their exonic m6As were lost.
Figure 5.
Figure 5.
mRNAs with short T1/2s are enriched for multiple m6As. (A) mRNAs with shorter T1/2s have higher m6A density in HeLa cells. Tani et al. (2012) and our data on m6A location within the mRNAs were used to determine any correlation between T1/2 and m6A content. (B) mRNAs with shorter T1/2s have higher m6A density in mouse ESCs. (C) The scatter density plot of m6A peak numbers for mRNA T1/2s for individual mRNAs (dots). (D) Proportion of mRNAs with no, one, or multiple m6As in four quartiles of mRNAs with different T1/2s (a range of 0.6–40 h). (E) The amount of mRNA versus mRNA T1/2, grouped by m6A numbers per mRNA. The T1/2 distribution of mRNAs is plotted as a function of m6A content. (**) P < 10−9; (***) P < 10−100, Wilcox ranked test. (F) The effect of position of m6A on T1/2 within mRNA. (**) P < 10−6; (***) P < 10−38, Wilcox ranked test. There is little correlation between internal exon m6A (mostly CDS) and last exon m6A (mostly 3′ UTR). (G) m6A peaks on mRNAs with short T1/2s that tend to be more closely spaced on mRNAs with short T1/2s are labeled in brown; mRNAs with long T1/2s are labeled in purple. (***) P < 10−20, Wilcox ranked test. We observed the same result even when matching the m6A numbers in both groups of mRNAs.
Figure 6.
Figure 6.
Data analysis of mouse ESC m6A residues in mRNA. (A) Global reduction of m6A after Mettl3 knockout. (***) P < 10−5; (n.s.) not significant, two-sample t-test. (B) Scatter density plot of the number of m6A peaks lost per mRNA versus mRNA T1/2 changes. “m6A peaks lost” refers to m6A peaks that were detected in wild-type mRNA but not in knockout mRNA (red dots in Supplemental Fig. 11). (C) Cumulative distribution plot of mRNAs versus mRNA T1/2 changes upon global m6A loss, grouped by the different regions of mRNA where m6A loss occurred. (**) P < 10−10; (***) P < 10−100, Kolmogorov-Smirnov test. (D) Cumulative distribution plot of mRNA versus mRNA T1/2 changes upon global m6A loss, grouped by the number of m6A peak loss per mRNA. (***) P < 10−40, Kolmogorov-Smirnov test. (E) The effect of m6A loss on mRNA T1/2 changes in different m6A content and different T1/2s in mouse ESCs. (Gray) No m6A per mRNA; (red) single m6A per mRNA; (blue) multiple m6As per mRNA. (***) P < 10−5; Wilcox ranked test. (F) Same mRNAs as in E but comparison is of steady-state mRNA levels from groups with different T1/2s. (***) P < 10−5, Wilcox ranked test. (G) m6As on mRNAs with T1/2s increased most upon global m6A loss tend to be clustered. The largest T1/2 effect upon global m6A loss is labeled in pink, and the average and least T1/2 effect are labeled in green. (***) P < 10−15; Wilcox ranked test. We observed the same result even when matching the m6A numbers in both groups of mRNAs.
Figure 7.
Figure 7.
mRNAs with or without m6As are associated with important biological functions, and minigene mutational validation for m6A specifies mRNA turnover. (A) Most mRNAs of key genes controlling the ESC state (data modified from Young 2011; the detailed transcriptional regulation information and connection between terms are described fully in Young 2011) have multiple m6A peaks. mRNAs are symbolized as ellipse shapes. (Gray) No m6A; (red) single m6A; (dark blue) multiple m6A peaks; (T1/2 WT) the mRNA T1/2 in wild-type mouse ESCs; (T1/2 KO) the mRNA T1/2 in mouse ESCs with Mettl3 knockout (details in Fig. 6). The thick black lines connecting genes symbolize transcriptional regulation. (B) GO analysis of 12 groups of mRNAs (12 = 3 × 4: combinations of four T1/2 groups [Q1, Q2, Q3, and Q4] and three m6A groups [no m6A, single m6A, or multiple m6A peaks per mRNA]). The values of −log10(FDR) are illustrated as a heat map. None of mRNA groups in Q2 and Q3 T1/2 groups showed enrichment in any GOs. A specific GO example was provided for each of the three mRNAs groups: Q1 and multiple m6As, Q1 and no m6A, and Q4 and no m6A. (C) The m6A information flow from chromatin, nucleoplasm, and cytoplasm as an important implication. It is based on the fact that m6A modification is the same in the newly formed pre-mRNA as in the nucleoplasmic and steady-state cytoplasmic mRNAs (Fig. 2A,B). (D) Illustration of the minigene experiment, using Ppp1r8 as an example. The CDS of Ppp1r8 mRNA contains three precise m6A sites identified by m6A-CLIP (three vertical lines). This m6A-containing region was cloned to a minigene vector in-frame with GFP. Three synonymous point mutations (three red crosses) abolished the three precise m6A sites without altering the underlying amino acid sequence (detailed sequences for both the wild type and mutant are in the Supplemental Material). (E) Upon global loss of m6A in Mettl3 knockout mouse ESCs, which completely abolished the m6A peaks in Ppp1r8 mRNA, the mRNA T1/2 increased from 2 to 3.8 h. (***) P < 0.001, t-test. (F) Three synonymous mutations in the minigene increase the minigene mRNA T1/2 from ∼3 to ∼7 h. (***) P < 0.001, t-test. (G) Three synonymous mutations in the minigene decreased m6A signal in wild-type mRNA to approximately one-third in knockout mRNA. (***) P < 0.001, t-test. (H) Illustration of the minigene experiment in Sox2. The CDS of Sox2 mRNA contains 20 precise m6A sites identified by m6A-CLIP (20 vertical lines). A mRNA region containing 15 precise m6A sites was cloned to a minigene vector in-frame with GFP. Fifteen point mutations (illustrated by 15 red crosses: four synonymous mutations in the coding region and 11 point mutations in the 3′ UTR that mutate the “A” in RAC motif to “T”) abolished the 15 precise m6A sites without altering the underlying amino acid sequence (detailed sequences for both the wild type and mutant are in the Supplemental Material). (I) Upon global loss of m6A in Mettl3 knockout mouse ESCs, which completely abolished the m6A peaks in Sox2 mRNA, the mRNA T1/2 increased from 1.3 to 2.2 h. (***) P < 0.001, t-test. (J) Point mutations in the minigene increase the minigene mRNA T1/2 from ∼3 to ∼8 h. (***) P < 0.001, t-test. (K) Point mutations in the minigene decreased m6A signal in wild-type mRNA to approximately one-sixth in knockout mRNA. (***) P < 0.001, t-test.

Comment in

Similar articles

Cited by

References

    1. Bachenheimer S, Darnell JE. 1975. Adenovirus-2 mRNA is transcribed as part of a high-molecular-weight precursor RNA. Proc Natl Acad Sci 72: 4445–4449. - PMC - PubMed
    1. Batista PJ, Molinie B, Wang J, Qu K, Zhang J, Li L, Bouley DM, Lujan E, Haddad B, Daneshvar K, et al. 2014. m6A RNA modification controls cell fate transition in mammalian embryonic stem cells. Cell Stem Cell 15: 707–719. - PMC - PubMed
    1. Bhatt DM, Pandya-Jones A, Tong AJ, Barozzi I, Lissner MM, Natoli G, Black DL, Smale ST. 2012. Transcript dynamics of proinflammatory genes revealed by sequence analysis of subcellular RNA fractions. Cell 150: 279–290. - PMC - PubMed
    1. Bokar JA, Rath-Shambaugh ME, Ludwiczak R, Narayan P, Rottman F. 1994. Characterization and partial purification of mRNA N6-adenosine methyltransferase from HeLa cell nuclei. Internal mRNA methylation requires a multisubunit complex. J Biol Chem 269: 17697–17704. - PubMed
    1. Bokar JA, Shambaugh ME, Polayes D, Matera AG, Rottman FM. 1997. Purification and cDNA cloning of the AdoMet-binding subunit of the human mRNA (N6-adenosine)-methyltransferase. RNA 3: 1233–1247. - PMC - PubMed

Publication types

  NODES
INTERN 22
Project 1
twitter 2