. 2017 Aug;24(8):620-631.
doi: 10.1038/nsmb.3432. Epub 2017 Jul 10.

PAR-TERRA directs homologous sex chromosome pairing

Affiliations

PAR-TERRA directs homologous sex chromosome pairing

Hsueh-Ping Chu et al. Nat Struct Mol Biol. 2017 Aug.

Abstract

In mammals, homologous chromosomes rarely pair outside meiosis. One exception is the X chromosome, which transiently pairs during X-chromosome inactivation (XCI). How two chromosomes find each other in 3D space is not known. Here, we reveal a required interaction between the X-inactivation center (Xic) and the telomere in mouse embryonic stem (ES) cells. The subtelomeric, pseudoautosomal regions (PARs) of the two sex chromosomes (X and Y) also undergo pairing in both female and male cells. PARs transcribe a class of telomeric RNA, dubbed PAR-TERRA, which accounts for a vast majority of all TERRA transcripts. PAR-TERRA binds throughout the genome, including to the PAR and Xic. During X-chromosome pairing, PAR-TERRA anchors the Xic to the PAR, creating a 'tetrad' of pairwise homologous interactions (Xic-Xic, PAR-PAR, and Xic-PAR). Xic pairing occurs within the tetrad. Depleting PAR-TERRA abrogates pairing and blocks initiation of XCI, whereas autosomal PAR-TERRA induces ectopic pairing. We propose a 'constrained diffusion model' in which PAR-TERRA creates an interaction hub to guide Xic homology searching during XCI.


Figures

Figure 1
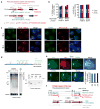
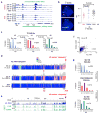
Figure 1. Homologous sex chromosome pairing via the pseudoautosomal region (PAR) in differentiating XX and XY ES cells
a. DNA FISH pairing assays using Xic, Arhgap6 (BAC RP23-461E16), and Hprt probes in female ES cells undergoing differentiation on d0 and d4. FISH signals are pseudocolored as indicated. b. Dotplot of inter-allelic distances for the top decile of nuclei (with smallest distances) shown in Fig. 1a and S1g. ND, normalized distance = distance/nuclear diameter. P values determined using two-tailed student t-test. c. Multi-color DNA FISH shows PAR:PAR pairing in both male and female ES cells. P34568 sub-probe sets derived from RP24-500I4 were used to detact the PAR. Additional X-linked (Hprt, Xic, Arhgap6 [Arh]) and Y-linked (Sry) were used as controls both to rule out full-length pairing and to ensure efficient hybridization to both homologues. We scored only those nuclei with discernible signals for both PAR and control locus. Multiple biological replicates showed similar results. d. PAR-to-PAR distances for the top decile during female and male ES cell differentiation for the experiment in c. P values determined using two-tailed student t-test. e. Left panel: Serial RNA-DNA FISH using X and Y painting probes to detect ChrX and ChrY (DNA FISH) and using a TERRA probe to detect the distal telomeric ends (RNA FISH) in d4 male ES cells. Right panel: Histogram shows that, on d4 of differentiation, X- and Y-PAR signals are frequently merged (one dot, or unresolvable dots considered true pairing events). P value determined using Fisher exact test. f. Dotplot of the top decile of inter-TERRA distances in d0 versus d4 male ES cells. P value was determined using two-tailed student t-test.
Figure 2
Figure 2. PAR transcripts produced by the sex chromosomes
a. The pseudoautosomal region (PAR) at the distal ends of Chr X and Y. Dotted purple lines indicate that this region is incompletely sequenced and assembled in the current genome assemblies (mm9, mm10). Mid1 and Erdr1 have repeated fragments within PAR (brown and purple triangles). The telomeric repeats (red bars) are present within PAR. PAR BAC clones: 15 kb BAC RP24-143B12 and the ~146 kb RP24-500I4. b. Quantitation of percent overlapping TERRA and PAR RNA signals for the experiments in c. Multiple biological replicates showed similar results. c. Two color RNA FISH detecting TERRA (Alexa488, green) and PAR transcripts (BAC probes, Cy3, red) in ES cells. d. Top panel: Map of sub-BAC probes and PCR amplicons. Left panel: Northern blot analysis of PAR-TERRA in ES cells using TERRA-specific or PAR-specific oligo probes. Left panel: Northern blot analysis of PAR-TERRA RNA using either TERRA or PAR-36K oligo probes in ES cells on different differentiation days. GAPDH, loading control. Right panel: Primer extension using an antisense TERRA oligo probe with PCR amplification using PAR-specific primer pairs located at 33, 36, and 39 k (kb) from the end of BAC RP24-500I4. +, with RT; −, without RT. e. RNA FISH indicating colocalization of TERRA and PAR signals at both large and small foci in ES cells. Three-color RNA FISH (upper panel): TERRA oligo probe (cyan blue); PAR-specific probes, 47k (green) and 29k (red). Two-color RNA FISH (lower panel): TERRA oligo probe (green); PAR specific probe, 31k (cyan blue). DAPI (blue) for nuclear stain. Right graph, quantitation of colocalization. f. IGV screenshots of TERRA-capture RNA-seq experiments show deduced PAR-TERRA transcription start sites. PAR transcripts are linked to telomeric repeat RNA. RT was conducted with TERRA-specific primers versus random hexamers, as indicated.
Figure 3
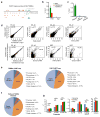
Figure 3. Mapping genomic PAR-TERRA binding sites by CHIRT-seq
a. PAR CHIRT using five capture probe sets: 29k, 31k, 34k, 36k, and 47k. Each probe cocktail is shown as bars with matching colors. b. Quantitative PCR showing the enrichment of PAR DNA in TERRA-AS CHIRT and PAR CHIRT, but not TERRA-S CHIRT in ES cells. c. Enrichment of PAR DNA following TERRA CHIRT was observed only when eluted with RNaseH. Enrichment was abolished by RNase A pre-treatment. d. Scatterplot analysis comparing Log2 coverages of TERRA and PAR CHIRT. Pearson’s r shown. CHIRT results were normalized to input unless otherwise indicated. e. Pie charts show relative representation of various genomic regions in PAR CHIRT in d0 female ES cells, as compared to TERRA CHIRT. f. Peaks in common between PAR and TERRA CHIRT. g. CEAS analysis shows significant over-representation of noncoding sequences in PAR and TERRA CHIRT in d0 ES cells. ***, P<0.001 (one-sided binomial test). The genome reference was obtained from the CHIRT-seq input.
Figure 4
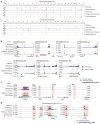
Figure 4. CHIRT-seq: PAR-TERRA RNA binds in cis and in trans throughout the genome
a. CHIRT-seq tracks representing PAR-TERRA enrichment at chromosomal ends in female ES cells and MEFs. PAR data are compared to TERRA data , and are normalized to input (TERRA/input, PAR/Input), no-RNase H control (TERRA/no RNase H), or the sense control (TERRA/sense). b. PAR-TERRA enrichment in subtelomeric regions of multiple autosomes in female ES cells. Red bars, TTAGGG repeats. Pink bars, sequence gaps. c. PAR-TERRA binds to internal chromosomal regions as well. d. PAR-TERRA binds to pseudoautosomal regions of ChrX and ChrY.
Figure 5
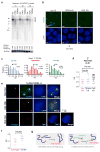
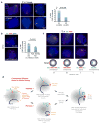
Figure 5. PAR-TERRA mediates trans-PAR pairing of sex chromosomes
a. PAR-TERRA depletion by LNA-mediated knockdown. Northern blot analysis after knockdown at various timepoints (1h, 3h and 6h) in female ES cells. Control, scrambled LNA gapmer (Scr KD). PAR KD, LNA against PAR-31K sequence, TERRA KD, LNA against UUAGGG repeats. Fraction remaining is quantitated by densitometry. GAPDH mRNA, loading control. b. TERRA RNA signals are greatly reduced after PAR or TERRA knockdown. RNA FISH detecting TERRA (green, (TAACCC)7-Alexa488) after 6 hours of knockdown in female ES cells. Blue, DAPI-stained nuclei. c. PAR-TERRA knockdown disrupts inter-PAR pairing in female ES cells. Full distributions of inter-PAR distances in d4 ES cells after PAR-TERRA versus control (Scr) knockdown for 6 hours. P values determined by the KS test. Mean values indicated by triangles. d. Dotplot of inter-PAR distances for the top decile of nuclei shown in c. P values determined using two-tailed student t-test. e. Analysis of ES cells carrying a PAR-TERRA transgene (Tg, RP24-500I4 BAC). Top panel: RNA FISH using indicated probes show Tg PAR-TERRA expression (arrows). Middle panel: DNA FISH distinguishes location of Tg (P1 vecto-PAR colocalization, asterisks) from endogenous PAR. Lower panel: Three colored-DNA FISH for P1, Arhgap6, and Hprt. f. Dot plot shows Tg-Arhgap6 pairing in PAR-TERRA Tg cells. Top decile shown in dotplot. P values determined using a two-tailed student t-test. g. A cartoon rendering the dynamics of PAR:PAR pairing in wildtype ES cells (left panel) and Tg-PAR pairing in Tg ES cells (right panel).
Figure 6
Figure 6. Intra-chromosomal interactions between PAR and Xic occur in a PAR-TERRA-dependent manner
a. Time-course analysis (d0, d3, d7 ES cells; MEFs) using PAR-TERRA CHIRT-seq reveals binding sites at the Xic pairing center. b. PAR-TERRA knockdown disrupts inter-Xic pairing in d4 female ES cells at 6h post-transfection. Left panel: DNA FISH using probes to the Xic, PAR, and Arhgap6 in d4 female ES cells. Arhgap6 signals served as hybridization control and ensured scoring only those nuclei with two discernible signals for each probe. Right panel: Dotplot of inter-allelic distances shown for the top decile of nuclei. P values were determined using two-tailed student t-test. c. Frequency of PAR-Xic association in differentiating female ES cells (d0, d4, d8). Full distributions of PAR-Xic distances are shown. n, sample size. Triangles, mean values. P values determined by the KS test. d. Heatmap of 4C analysis with a viewpoint at PAR/Erdr1 in d0 and d4 female mESCs and in MEFs. The heatmap represents the log mean coverage for a given window size (100k-5Mb sliding windows). Two biological replicates show the similar pattern of interactions. Significance of interaction between Xic and PAR was determined by fitting the observed empirical distribution of normalized contact data with Weibull distribution and calculating p-values. The “*” indicates the PAR:Xic interaction in d4 ES cells. e. Strong correlation between contact frequencies (blue track, 4C) and PAR-TERRA RNA binding (green tracks, CHIRT) in female ES cells undergoing XCI (d4). f. Scatterplot: 4C analysis of post-XCI female MEFs also showed strong correlation between PAR-TERRA binding (CHIRT) and PAR interaction frequency (4C). Pearson’s r = 0.69. Each dot represents the mean coverage of 100 kb bin size for 4C (X-axis) and CHIRT-seq (Y-axis) in the scatterplot. g. Frequency of PAR-Xic and Hprt-Xic associations in differentiating d4 female ES cells after Scr or PAR-TERRA knockdown for 6 hours. Full distributions for each pairwise distance measurements are shown. n, sample size. P values determined by the KS test.
Figure 7
Figure 7. The tetrad as a hub for pairing interactions
a. DNA FISH using probes to the Xic, PAR, and Arhgap6 in d4 female ES cells reveals a high frequency of tetrads. Mean percentages are plotted in graph, with sample sizes (n) and statistical analysis. P value determined using Fisher’s exact test. b. DNA FISH shows that PAR-TERRA knockdown disrupts tetrad formation at 6h post-transfection in d4 femal ES cells. Three biological replicates are averaged. N, sample sizes. P value determined using Fisher’s exact test. c. Cartoons show possible pairing species and the prevalence (relative ratio) of each in d4 female ES cells. DNA FISH images for two representative examples of each species are shown above the cartoon. Xic:Xic pairs without PAR interaction are not observed. d. Constrained Diffusion Model for homology-searching. PAR-TERRA RNA binds to the pseudoautosomal region and the Xic in ES cells. In Pathway 1, PAR-TERRA then directs PAR:PAR interactions, followed by PAR:Xic interactions, which then facilitate Xic:Xic homology searching and pairing. In Pathway 2, PAR-TERRA directs PAR:Xic interactions in cis, followed by PAR:PAR pairing, which in turn facilitates Xic:Xic homology searching and pairing. The two pathways are not mutually exclusive. PAR-TERRA RNA is required for all pairwise interactions.
Figure 8
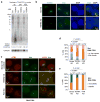
Figure 8. PAR-TERRA is required for proper initiation of XCI
a. TERRA depletion by LNA-mediated knockdown. Northern blot analysis after knockdown at various timepoints (6h, 24h and 48h). LNA transfection started on differentiation d4 in female ES cells. Control, scrambled LNA gapmer (Scr KD). TERRA KD, LNA against UUAGGG repeats. Fraction remaining is quantitated by densitometry. GAPDH mRNA, loading control. b. Xist RNA FISH after LNA knockdown for 48 hours. LNA transfection started on differentiation d4 in female ES cells and RNA FISH performed on d6 cells. %nuclei with Xist clouds: For Scr KD: d5, 3.6% (n=166); d6, 6.9% (n=173); d8, 29.1% (n=168). For TERRA KD: d5, 2.0% (n=196); d6, 3.5% (n=169); d8, 17.8% (n=219). The difference between Scr and TERRA KD on d8 is significant (P=0.01), as determined by Fisher exact test. c. RNA FISH shows that depletion of either PAR or TERRA results in blunted Xist upregulation and failure of XCI. LNA was introduced on differentiation d4 in female ES cells, and Xist and ATRX RNA FISH was performed on d8 cells. Control KD, TERRA-sense LNA gapmer. TERRA KD, LNA against UUAGGG repeats. PAR KD, LNA against PAR-31K sequence. d. Bar graph shows percentage of cells with Xist clouds on d8 of female ES differentiation for the experiment in c. There appeared to be robust Xist upregulation after treatment with sense LNA. The opposite effects achieved by sense versus TERRA LNA achieved opposite effects supports specificity of the TERRA knockdown and the effect of TERRA on Xist upregulation. P values were determined by Fisher exact test. n, sample size. e. Bar graph shows percentage of cells with monoallelic and biallelic Atrx expression on d8 for the experiment in c. P values were determined by Fisher exact test. n, sample size.

Similar articles

Cited by

References

    1. Azzalin CM, Reichenbach P, Khoriauli L, Giulotto E, Lingner J. Telomeric Repeat Containing RNA and RNA Surveillance Factors at Mammalian Chromosome Ends. Science. 2007;318:798–801. - PubMed
    1. Schoeftner S, Blasco MA. Developmentally regulated transcription of mammalian telomeres by DNA-dependent RNA polymerase II. Nature Cell Biology. 2007;10:228–236. - PubMed
    1. Zhang LF, et al. Telomeric RNAs Mark Sex Chromosomes in Stem Cells. Genetics. 2009;182:685. - PMC - PubMed
    1. Azzalin CM, Lingner J. Telomere functions grounding on TERRA firma. Trends Cell Biol. 2015;25:29–36. - PubMed
    1. Maicher A, Kastner L, Dees M, Luke B. Deregulated telomere transcription causes replication-dependent telomere shortening and promotes cellular senescence. Nucleic Acids Res. 2012;40:6649–59. - PMC - PubMed

LinkOut - more resources

  NODES
Association 2
INTERN 1
Project 1
twitter 2