. 2018 Jan;22(1):207-222.
doi: 10.1111/jcmm.13309. Epub 2017 Aug 7.

Impact of neonatal hypoxia-ischaemia on oligodendrocyte survival, maturation and myelinating potential

Affiliations

Impact of neonatal hypoxia-ischaemia on oligodendrocyte survival, maturation and myelinating potential

Malgorzata Ziemka-Nalecz et al. J Cell Mol Med. 2018 Jan.

Abstract

Hypoxic-ischaemic episodes experienced at the perinatal period commonly lead to a development of neurological disabilities and cognitive impairments in neonates or later in childhood. Clinical symptoms often are associated with the observed alterations in white matter in the brains of diseased children, suggesting contribution of triggered oligodendrocyte/myelin pathology to the resulting disorders. To date, the processes initiated by perinatal asphyxia remain unclear, hampering the ability to develop preventions. To address the issue, the effects of temporal hypoxia-ischaemia on survival, proliferation and the myelinating potential of oligodendrocytes were evaluated ex vivo using cultures of hippocampal organotypic slices and in vivo in rat model of perinatal asphyxia. The potential engagement of gelatinases in oligodendrocyte maturation was assessed as well. The results pointed to a significant decrease in the number of oligodendrocyte progenitor cells (OPCs), which is compensated for to a certain extent by the increased rate of OPC proliferation. Oligodendrocyte maturation seemed however to be significantly altered. An ultrastructural examination of selected brain regions performed several weeks after the insult showed however that the process of developing central nervous system myelination proceeds efficiently resulting in enwrapping the majority of axons in compact myelin. The increased angiogenesis in response to neonatal hypoxic-ischaemic insult was also noticed. In conclusion, the study shows that hypoxic-ischaemic episodes experienced during the most active period of nervous system development might be efficiently compensated for by the oligodendroglial cell response triggered by the insult. The main obstacle seems to be the inflammatory process modulating the local microenvironment.

Keywords: electron microscopy; gelatinases; hippocampal organotypic slices; myelin structure; myelinogenesis; neonatal hypoxia-ischaemia; oligodendrocyte progenitor cells; oxygen and glycose deprivation; perinatal asphyxia.


Figures

Figure 1
Figure 1
A schematic diagram of the experimental design. The parallel in vivo and in vitro studies have been established to model perinatal hypoxia‐ischaemia with aim of evaluating oligodendrocyte contribution to the resulting leukodystrophic disorders.
Figure 2
Figure 2
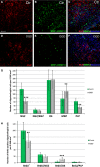
OPCs expressing NG2 marker (red) and active gelatinases (green) in rat hippocampus 14 days after H‐I; (A) characteristic structure of rat hippocampus with easy discernable neurogenic regions (DG and CA1); (BD) controls; (EG) injured animals (ipsilateral hemisphere, lower panel). Most of the gelatinase activity is localized within DG and CA1 regions. Scale bar corresponds to 100 μm.
Figure 3
Figure 3
Colocalization of OPCs and active gelatinases in selected regions of the brain 14 days after H‐I. Immunohistochemical double‐labelling of OPCs: NG2 marker (red) and MMP‐2/MMP‐9 (green) in: (A, B) hippocampus; (C, D) striatum and (E, F) cerebral cortex. Oligodendroglial progenitors expressing active gelatinases are numerous in the examined brain regions and some of them are indicated by white arrows on the magnifications of the boxed‐in areas. Scale bar is the equivalent of 100 μm. The relative number of OPCs expressing active forms of MMP‐2/MMP‐9 calculated versus: (G) total OPC fractions in selected regions of control and hypoxic‐ischaemic brains; (H) total number of gelatinase‐positive cells in developing rat brains. After H‐I, the fraction of gelatinase‐expressing OPCs decreases significantly within hippocampus. Comparison of NG2+/MMPs+ cell number with the total fraction of cells expressing gelatinases in rat brain after H‐I points to a significant down‐regulation of the former in hippocampus and in cerebral cortex. The one‐way analysis of variance (anova) followed by the Bonferroni's multiple comparison (n = 10, number of analysed brain slices was 12 for each animal). All values were expressed as mean ± S.D.; *P < 0.05.
Figure 4
Figure 4
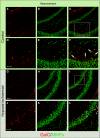
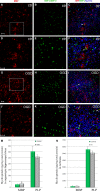
Similar number of differentiating oligodendrocytes visualized in control rat hippocampus and after hypoxic‐ischaemic episode: maturating GalC+ (red) and MMPs+ (green) cells. (A) GalC‐positive cells in controls; (B) gelatinase‐expressing cells in controls; (C) merge; (DF) Enlargement of the framed region. Lower panel: hippocampus of H‐I rats 14 days after the insult: (G) differentiating, GalC+ oligodendrocytes; (H) cells with active gelatinases; (I) merge. (JL) A magnified image of the boxed‐in area: differentiating oligodendrocytes characterized by the expression of the active gelatinases are indicated by the white arrows. Scale bar is the equivalent of 100 μm.
Figure 5
Figure 5
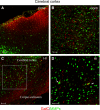
Differentiating cells in rat cerebral cortex: differentiating GalC‐expressing (red) oligodendrocytes and gelatinase‐positive cells (green). (A) Localization of cells in the outer region of coronal brain sections; (B) characteristic long oligodendroglial processes extended within the cerebral cortex. (C) Colocalization of oligodendrocyte cell body and gelatinases in cerebral cortex, while in corpus callosum cells are characteristically elongated. The white frame indicates the region magnified in the next picture. (D) Differentiating oligodendrocytes characterized by the expression of the active gelatinases (white arrows). Scale bar corresponds to 100 μm.
Figure 6
Figure 6
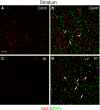
In striatum, maturating oligodendrocytes are characterized by ‘clump’ morphology (GalC, red); however, some of them express gelatinases (MMP‐2/MMP‐9, green), indicated by white arrows. (A, B) differentiating GalC+ oligodendrocytes in control rats; (C, D) significantly reduced number of GalC‐positive cells 14 days after hypoxic‐ischaemic insult. Scale bar corresponds to 100 μm.
Figure 7
Figure 7
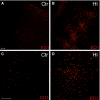
Increase in number of microglia in rat cerebral cortex 14 days after HI as indicated by cell labelling with ED1 marker (red). (A) Only few ED1+ cells could be found in the intact brain; (B) number of microglia significantly increases after hypoxic‐ischaemic insult; (C) magnification of control rat cerebral cortex with no signs of inflammation; (D) magnification of cerebral cortex after HI showing tremendous up‐regulation in number of cells associated with immunological response to the insult. Scale bar is the equivalent of 100 μm.
Figure 8
Figure 8
Effect of glucose and oxygen deprivation on the survival and proliferation of oligodendrocyte progenitors within organotypic hippocampal slices: (A) live image of control hippocampal slice; (B) OGD‐subjected slice with visible disintegration of its characteristic morphology; (C) NG2‐positive (red) progenitors in controls; (D) reduced number of NG2+ (red) progenitors after OGD insult; (E) oligodendrocyte progenitors (NG2+, red) expressing gelatinases (MMPs, green) in controls; (F) colocalization of NG2 marker (red) and gelatinase activity (green) in injured slices; (G) proliferating, Ki67+ (red) progenitors (NG2+, green) in control slices (white arrows indicate double‐labelled cells); (H) colocalization (white arrows) of OPCs (NG2, green) and marker of dividing cells‐Ki67 (red) 7 days after OGD, cell nuclei are stained with Hoechst 33258 (blue); (I) newly generated (BrdU+, green) OPC (NG2+, red) in control slices; (J) OPCs (NG2+, red) generated (BrdU+, green) after OGD insult; (K) immature (O4‐positive, red) BrdU+ (green) oligodendrocytes in controls; (L) double‐labelled immature oligodendrocytes (O4+, red), born‐as indicated by BrdU+ (green) incorporation‐after OGD procedure. Scale bar is equivalent of 50 μm.
Figure 9
Figure 9
Effect of glucose and oxygen deprivation on the survival, proliferation and differentiation of rat oligodendrocyte progenitors within organotypic hippocampal slices during 7 DIV. Anti‐PLP staining (red) of mature oligodendrocytes: Colocalization with gelatinases (green) was observed neither in control slices (AC) nor in slices injured by OGD procedure (DF). Cell nuclei (blue) are visualized with Hoechst 33258. Scale bar is the equivalent of 100 μm. (G) Statistical analysis of oligodendrocyte proliferation and maturation in slices subjected to OGD procedure; (H) statistical analysis of the amount of the OPCs which are newly born (BrdU+) after the insult and progress in their maturation. The calculated differences were marked as significant if: **P < 0.01; ***P < 0.001.
Figure 10
Figure 10
Amounts of major myelin components in both the organotypic hippocampal slices and in the rat brains 7 days after hypoxic‐ischaemic incident; (AC) mature, control MBP‐positive (red) oligodendrocytes in organotypic hippocampal slices, solely (white arrows) expressing gelatinases (green). (DF) enlargement of the white frame to show branched oligodendrocyte morphology; (GI) OGD‐subjected slices; (JL) magnification of the previous picture. Cell nuclei are stained with Hoechst 33258 (blue); Scale bar corresponds to 100 μm. (M) Quantitative analysis of MBP and PLP amounts in organotypic hippocampal slices; (N) quantitative analysis of MBP and PLP amounts in rat brains. The calculated differences were considered as significant if *P < 0.05.
Figure 11
Figure 11
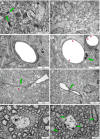
Brain ultrastructure of control and experimental rats 9 weeks (P70) after H‐I insult. (A) Characteristic organization of neuropil (easily discernable structural elements like, for example synapses; green arrows) within cerebral cortex of control animals. (B) Hydropic, oedematous neuropil in the H‐I brain parenchyma; (C) lumen of capillaries and vessels is smooth, with tight intercellular junctions between endothelial cells in controls; (D) vascular disorders in brains of H‐I rat: characteristic microvilli on endothelium surface (red asterisk) and a macrophage cell residing in the blood vessel wall (green arrow); (E) Collapsing blood vessel (green arrow) in the oedematous neuropil (red asterisk) in hippocampus of H‐I animals; (F) Bridging vessel (green arrows) in H‐I rats indicating an ongoing neovascularization; (G) compacted myelin enwrapping axons within striatum of control rats; (H) malformed myelin sheaths (green arrows) with splitting lamellae surrounding the oligodendroglial cell in striatum of H‐I rats.

Similar articles

Cited by

References

    1. Morrison BM, Lee Y, Rothstein JD. Oligodendroglia: metabolic supporters of axons. Trends Cell Biol. 2013; 23: 644–51. - PMC - PubMed
    1. Saab AS, Tzvetanova ID, Nave KA. The role of myelin and oligodendrocytes in axonal energy metabolism. Curr Opin Neurobiol. 2013; 23: 1065–72. - PubMed
    1. Baltan S. Can lactate serve as an energy substrate for axons in good times and in bad, in sickness and in health? Metab Brain Dis. 2015; 30: 25–30. - PMC - PubMed
    1. Nishiyama A. Polydendrocytes: NG2 cells with many roles in development and repair of the CNS. Neuroscientist. 2007; 13: 62–76. - PubMed
    1. Hughes EG, Kang SH, Fukaya M, et al Oligodendrocyte progenitors balance growth with self‐repulsion to achieve homeostasis in the adult brain. Nat Neurosci. 2013; 16: 668–76. - PMC - PubMed

Publication types

LinkOut - more resources

  NODES
twitter 2