Metabolomic and transcriptomic profiling of hepatocellular carcinomas in Hras12V transgenic mice
- PMID: 28941178
- PMCID: PMC5633588
- DOI: 10.1002/cam4.1177
Metabolomic and transcriptomic profiling of hepatocellular carcinomas in Hras12V transgenic mice
Abstract
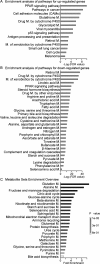
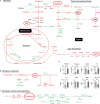
Activation of the Ras/MAPK pathway is prevalently involved in the occurrence and development of hepatocellular carcinoma (HCC). However, its effects on the deregulated cellular metabolic processes involved in HCC in vivo remain unknown. In this study, a mouse model of HCC induced by hepatocyte-specific expression of the Hras12V oncogene was investigated using an integrative analysis of metabolomics and transcriptomics data. Consistent with the phenotype of abundant lipid droplets in HCC, the lipid biosynthesis in HCC was significantly enhanced by (1) a sufficient supply of acetyl-CoA from enhanced glycolysis and citrate shuttle activity; (2) a sufficient supply of NADPH from enhanced pentose phosphate pathway (PPP) activity; (3) upregulation of key enzymes associated with lipid biosynthesis; and (4) downregulation of key enzymes associated with bile acid biosynthesis. In addition, glutathione (GSH) was significantly elevated, which may result from a sufficient supply of 5-oxoproline and L-glutamate as well as an enhanced reduction in the process of GSSG being turned into GSH by NADPH. The high level of GSH along with elevated Bcl2 and Ucp2 expression may contribute to a normal level of reactive oxygen species (ROS) in HCC. In conclusion, our results suggest that the lipid metabolism, glycolysis, PPP, tricarboxylic acid (TCA) cycle, citrate shuttle activity, bile acid synthesis, and redox homeostasis in the HCC induced by ras oncogene are significantly perturbed, and these altered metabolic processes may play crucial roles in the carcinogenesis, development, and pathological characteristics of HCC.
Keywords: Hepatocellular carcinoma; Ras oncogene; metabolomics; transcriptomics.
© 2017 The Authors. Cancer Medicine published by John Wiley & Sons Ltd.
Figures


Similar articles
-
Role of the Mitochondrial Citrate-malate Shuttle in Hras12V-Induced Hepatocarcinogenesis: A Metabolomics-Based Analysis.Metabolites. 2020 May 13;10(5):193. doi: 10.3390/metabo10050193. Metabolites. 2020. PMID: 32414018 Free PMC article.
-
Tissue metabolomics of hepatocellular carcinoma: tumor energy metabolism and the role of transcriptomic classification.Hepatology. 2013 Jul;58(1):229-38. doi: 10.1002/hep.26350. Epub 2013 May 8. Hepatology. 2013. PMID: 23463346 Free PMC article.
-
Metabolomic Analysis of Liver Tissues for Characterization of Hepatocellular Carcinoma.J Proteome Res. 2019 Aug 2;18(8):3067-3076. doi: 10.1021/acs.jproteome.9b00185. Epub 2019 Jul 1. J Proteome Res. 2019. PMID: 31188000 Free PMC article.
-
Pleiotropic effects of methionine adenosyltransferases deregulation as determinants of liver cancer progression and prognosis.J Hepatol. 2013 Oct;59(4):830-41. doi: 10.1016/j.jhep.2013.04.031. Epub 2013 May 7. J Hepatol. 2013. PMID: 23665184 Review.
-
Comparative and integrative functional genomics of HCC.Oncogene. 2006 Jun 26;25(27):3801-9. doi: 10.1038/sj.onc.1209561. Oncogene. 2006. PMID: 16799621 Review.
Cited by
-
Role of the Mitochondrial Citrate-malate Shuttle in Hras12V-Induced Hepatocarcinogenesis: A Metabolomics-Based Analysis.Metabolites. 2020 May 13;10(5):193. doi: 10.3390/metabo10050193. Metabolites. 2020. PMID: 32414018 Free PMC article.
-
Kinetic modelling of quantitative proteome data predicts metabolic reprogramming of liver cancer.Br J Cancer. 2020 Jan;122(2):233-244. doi: 10.1038/s41416-019-0659-3. Epub 2019 Dec 10. Br J Cancer. 2020. PMID: 31819186 Free PMC article.
-
Molecular probes for tracking lipid droplet membrane dynamics.Nat Commun. 2024 Oct 31;15(1):9413. doi: 10.1038/s41467-024-53667-7. Nat Commun. 2024. PMID: 39482302 Free PMC article.
-
Integrated analysis of transcriptomic and metabolomic data demonstrates the significant role of pyruvate carboxylase in the progression of ovarian cancer.Aging (Albany NY). 2020 Nov 7;12(21):21874-21889. doi: 10.18632/aging.104004. Epub 2020 Nov 7. Aging (Albany NY). 2020. PMID: 33177242 Free PMC article.
-
Omics-Based Identification of Shared and Gender Disparity Routes in Hras12V-Induced Hepatocarcinogenesis: An Important Role for Dlk1-Dio3 Genomic Imprinting Region.Front Genet. 2021 May 31;12:620594. doi: 10.3389/fgene.2021.620594. eCollection 2021. Front Genet. 2021. PMID: 34135934 Free PMC article.
References
-
- Parkin, D. M. , Bray F., Ferlay J., and Pisani P.. 2005. Global cancer statistics, 2002. CA Cancer J. Clin. 55:74–108. - PubMed
-
- Boguski, M. S. , and McCormick F.. 1993. Proteins regulating Ras and its relatives. Nature 366:643–654. - PubMed
-
- Hunter, T. 1997. Oncoprotein networks. Cell 88:333–346. - PubMed
-
- Wang, A. G. , Moon H. B., Lee M. R., Hwang C. Y., Kwon K. S., Yu S. L., et al. 2005. Gender‐dependent hepatic alterations in H‐ras12V transgenic mice. J. Hepatol. 43:836–844. - PubMed
MeSH terms
Substances
LinkOut - more resources
Full Text Sources
Other Literature Sources
Medical

