. 2017 Oct 16;13(10):e1007038.
doi: 10.1371/journal.pgen.1007038. eCollection 2017 Oct.

The homeodomain-interacting protein kinase HPK-1 preserves protein homeostasis and longevity through master regulatory control of the HSF-1 chaperone network and TORC1-restricted autophagy in Caenorhabditis elegans

Affiliations

The homeodomain-interacting protein kinase HPK-1 preserves protein homeostasis and longevity through master regulatory control of the HSF-1 chaperone network and TORC1-restricted autophagy in Caenorhabditis elegans

Ritika Das et al. PLoS Genet. .

Abstract

An extensive proteostatic network comprised of molecular chaperones and protein clearance mechanisms functions collectively to preserve the integrity and resiliency of the proteome. The efficacy of this network deteriorates during aging, coinciding with many clinical manifestations, including protein aggregation diseases of the nervous system. A decline in proteostasis can be delayed through the activation of cytoprotective transcriptional responses, which are sensitive to environmental stress and internal metabolic and physiological cues. The homeodomain-interacting protein kinase (hipk) family members are conserved transcriptional co-factors that have been implicated in both genotoxic and metabolic stress responses from yeast to mammals. We demonstrate that constitutive expression of the sole Caenorhabditis elegans Hipk homolog, hpk-1, is sufficient to delay aging, preserve proteostasis, and promote stress resistance, while loss of hpk-1 is deleterious to these phenotypes. We show that HPK-1 preserves proteostasis and extends longevity through distinct but complementary genetic pathways defined by the heat shock transcription factor (HSF-1), and the _target of rapamycin complex 1 (TORC1). We demonstrate that HPK-1 antagonizes sumoylation of HSF-1, a post-translational modification associated with reduced transcriptional activity in mammals. We show that inhibition of sumoylation by RNAi enhances HSF-1-dependent transcriptional induction of chaperones in response to heat shock. We find that hpk-1 is required for HSF-1 to induce molecular chaperones after thermal stress and enhances hormetic extension of longevity. We also show that HPK-1 is required in conjunction with HSF-1 for maintenance of proteostasis in the absence of thermal stress, protecting against the formation of polyglutamine (Q35::YFP) protein aggregates and associated locomotory toxicity. These functions of HPK-1/HSF-1 undergo rapid down-regulation once animals reach reproductive maturity. We show that HPK-1 fortifies proteostasis and extends longevity by an additional independent mechanism: induction of autophagy. HPK-1 is necessary for induction of autophagosome formation and autophagy gene expression in response to dietary restriction (DR) or inactivation of TORC1. The autophagy-stimulating transcription factors pha-4/FoxA and mxl-2/Mlx, but not hlh-30/TFEB or the nuclear hormone receptor nhr-62, are necessary for extended longevity resulting from HPK-1 overexpression. HPK-1 expression is itself induced by transcriptional mechanisms after nutritional stress, and post-transcriptional mechanisms in response to thermal stress. Collectively our results position HPK-1 at a central regulatory node upstream of the greater proteostatic network, acting at the transcriptional level by promoting protein folding via chaperone expression, and protein turnover via expression of autophagy genes. HPK-1 therefore provides a promising intervention point for pharmacological agents _targeting the protein homeostasis system as a means of preserving robust longevity.


Conflict of interest statement

The authors have declared that no competing interests exist.

Figures

Fig 1
Fig 1. hpk-1 activity is necessary and sufficient to regulate lifespan.
(A) hpk-1(pk1393) null mutant animals (red) are short-lived relative to wild-type N2 (black). Phpk-1::hpk-1::GFP largely restores wild-type lifespan to hpk-1(pk1393) mutant animals (green). Lifespan of non-transgenic hpk-1(pk1393) siblings (blue) is similar to hpk-1(pk1393). (B) Overexpression of hpk-1 using the heterologous sur-5 promoter increases lifespan compared to N2 (dark red versus black). Each graph is representative of at least 3 independent lifespan experiments. Full lifespan data can be found in S1 Table.
Fig 2
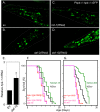
Fig 2. HPK-1 promotes protein homeostasis.
(A-C) hpk-1 activity affects the accumulation of Q35::YFP foci in muscle cells. Shown are representative images of Punc-54::polyQ::YFP animals treated with (A) control RNAi or (B) hpk-1 RNAi, and (C) transgenic animals overexpressing hpk-1 (Psur-5::HPK-1::CFP). (D) Time course of polyQ::YFP foci accumulation in conjunction with: treatment with control RNAi (black circles), hpk-1 RNAi (white circles), hpk-1(pk1393) (white squares), or hpk-1 overexpression (open triangles). Data points display the mean +/- standard deviation (S.D.) of at least 15 animals per biological replicate; at least 5 independent experiments were performed. P-values are provided in Results and in S3 Table. (E) Time course of paralysis of Punc-54::polyQ::YFP animals in conjunction with: treatment with control RNAi (black circles), hpk-1 RNAi (white circles), hpk-1(pk1393) (white squares), or hpk-1 overexpression (open triangles). Plotted data display the results for a single biological replicate. P-values and data from all trials are provided in S3 Table.
Fig 3
Fig 3. hpk-1 and hsf-1 have overlapping functions in longevity control and the preservation of proteostasis.
(A) hpk-1(pk1393) null mutant animals are short-lived compared to wild-type controls (red versus black) and hsf-1(RNAi) does not further shorten hpk-1(pk1393) lifespan (maroon versus gray). (B) Overexpression of hpk-1 increases lifespan (dark green versus black) and is hsf-1 dependent (light green). (C) Constitutive hsf-1 overexpression increases lifespan (blue versus black) and is hpk-1 dependent (light blue). Each graph is representative of at least 3 independent lifespan experiments. Full lifespan data can be found in S1 Table. (D-E) Simultaneous loss of hpk-1 and hsf-1 does not produce additive detrimental effects on protein homeostasis (maroon versus red). (D) Time course of Punc-54::Q35::YFP foci accumulation in conjunction with: treatment with control RNAi (filled circles/squares), hsf-1 RNAi (white circles/squares) in either wild-type (black traces) or the hpk-1(pk1393) null mutant background (colored traces). Data are the mean +/- S.D. of at least 15 animals from one representative trial; at least 5 independent experiments were performed. P-values are provided in Results and S3 Table. (E) Time course of paralysis of Punc-54::polyQ::YFP animals after treatment with control RNAi (filled circles/squares) or hsf-1 RNAi (white circles/squares) in either wild-type (black traces) or the hpk-1(pk1393) null mutant background (colored traces). Data is representative of one biological replicate, with at least 5 independent replicates performed. P-values and data from all trials are provided in S3 Table.
Fig 4
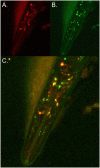
Fig 4. HPK-1 colocalizes with HSF-1 in C. elegans neurons.
(A-C) HPK-1 and HSF-1 colocalize in neurons under basal conditions. Representative image of transgenic animal co-expressing Phpk-1::HPK-1::tdtomato,Phsf-1::HSF-1::GFP: (A) red fluorescence, (B) green fluorescence, and (C) overlay.
Fig 5
Fig 5. hpk-1 regulates thermotolerance.
(A) hpk-1 is required for normal thermotolerance, as hpk-1(pk1393) has impaired survival at 35°C (red vs. black), which is rescued by transgenic Phpk-1::hpk-1::GFP (green). Graph represents survival data from one representative trial of three independent replica set experiments. Additional trials can be found in S2 Table; see methods and [38, 72] for additional details and statistical analysis. (B) hpk-1 overexpression increases survival to thermal stress (column 3 versus 1), dependent on hsf-1 (column 4 versus 2). Plotted data show mean and S.E.M. of a representative trial (trial 1) with 3–4 technical replicates per condition; # above each column represents total number of animals scored per condition. See S2 Table for additional details. *** indicates p-values of <0.001. P-values were calculated using ANOVA with Tukey’s HSD post-hoc, and were corrected to account for multiple testing. See S2 Table for additional trial data.
Fig 6
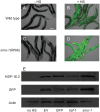
Fig 6. hpk-1 prevents sumoylation of HSF-1.
(A) Changes in HSF-1 post-translational modifications between early L4 wild-type and hpk-1(pk1393) animals were examined by western blot to HSF-1; smo-1(RNAi), which _targets C. elegans SUMO, was used to block sumoylation, dePhos is lambda protein phosphatase treatment (other samples were mock treated). Beta-actin serves as a loading control. The ratio of modified to unmodified HSF-1 is 0.35, 0.51, and 0.35 for N2/ev, hpk-1(pk1393)/ev, and hpk-1(pk1393)/smo-1(RNAi), respectively (see S3A Fig for additional data). (B) hpk-1 prevents sumoylation of HSF-1. Ratio of HSF-1 unmodified (75kD) to modified (90-95kD, sumoylated and sumoylated plus phosphorylated). The S.E.M. from Image J quantification is shown for seven N2 and hpk-1(pk1393) replicates (* p<0.02, Student’s t-test, see S3B and S3C Fig for additional data). (C) Loss of hpk-1 induces HSF-1 in L4 animals. Protein levels of unmodified (75kD, grey), modified (90-95kD, red) HSF-1, and beta-actin were quantified in ImageJ for four replicates (see S3C Fig for additional data). (For total, upper, and lower MW fold change (respectively): ** p<0.01, <0.01, and <0.02, Student’s t-test). (D) Immunoprecipitation of HSF-1 from hpk-1(pk1393) animals followed by SUMO protease or mock treatment. First lane is protein extract prior to immunoprecipitation. Lysate was precleared of nonspecific interactions by treatment with normal rabbit serum (Invitrogen #01–6101) that was then immunoprecipitated (lane 2). Precleared lysate was then evenly divided and treated with either preimmunized rabbit serum (i.e. serum from the rabbit in which C. elegans HSF-1 antibodies were generated, prior to immunization, lane 3) or HSF-1 antiserum, followed by immunoprecipitation. Immunoprecipitated HSF-1 was then either mock treated or treated with SUMO protease (lanes 4 and 5). See methods for additional details.
Fig 7
Fig 7. Heat shock induction of hsp-16.2 is enhanced by smo-1(RNAi).
(A-D) DIC and GFP overlay for Phsp-16.2::GFP worms on empty vector (A, B) or smo-1(RNAi) (C, D) with (+HS) and without (-HS) heat shock. Scale bar = 100μm. (E) Western blot for HSP-16.2, GFP and β-actin from hsp-16.2p::GFP worms grown on empty vector (EV) without heat shock (no HS) or with heat shock (EV), GFP(RNAi), hsf-1(RNAi) or smo-1(RNAi). Fold-increases for HSP-16.2/actin on smo-1(RNAi) relative to EV in three independent replicates were 2.4, 4.7, and 1.8.
Fig 8
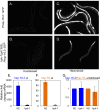
Fig 8. hpk-1 regulates induction of the heat shock response.
(A-D) Representative images of at least 30 Phsp-16.2::GFP animals in wild type (A, C) and hpk-1(pk1393) animals (B, D) under basal conditions (A, B) or after heat shock (C, D). Animals are outlined in panels A-B. (E-F) Induction of endogenous hsp-16.2 (E) and hsp-70 (C12C8.1) (F), in N2 and hpk-1(pk1393) animals as measured by qRT-PCR. (G) Loss of hpk-1 did not alter endogenous expression of hsp-16.2 (blue) or hsp-70 (orange). Values in (E-G) are normalized to expression of act-1 and the mean fold change relative to wild-type animals, and the S.E.M. between technical replicates is shown. In total three independent experiments were performed with similar results. P-values for (E) and (F) are <0.05 and <0.01, respectively (Student’s t-test).
Fig 9
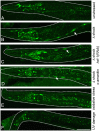
Fig 9. hpk-1 protein expression is stimulated by heat shock.
(A) Expression of HPK-1 protein (Phpk-1::HPK-1::GFP) under basal conditions is primarily restricted to neurons. Fluorescent intestinal speckles are non-specific gut granules[111]. (B-D) Heat shock induces HPK-1 protein (Phpk-1::HPK-1::GFP) levels most strongly within hypodermal seam cells (indicated by arrows) independent of hsf-1 (C) and transcription (D). Phpk-1::HPK-1::GFP animals after heat shock with (B) empty vector HT115, (C) hsf-1(RNAi), and (D) α-amanitin treatment. Increased HPK-1 expression within neurons and hypodermal seam cells is specific to heat stress as neither oxidative stress (E) or UV damage (F) altered expression. White space was artificially filled for some images and animals are outlined. GFP quantification and further analysis can be found in S6 Fig.
Fig 10
Fig 10. Decreased TORC1 activates HPK-1 to extend longevity.
(A-D) Decreased TORC1 induces neuronal expression of HPK-1. Representative images of Phpk-1::HPK-1::GFP neuronal expression in day 3 adult animals after treatment with control (A), daf-2 (B), rict-1 (C) and daf-15 RNAi (D). Outlines of animals are traced in white. White space was artificially filled for (D). Additional images and quantification can found in S9 Fig. (E) Induction of endogenous hpk-1 after daf-15 inactivation as measured by qRT-PCR. Values are mean fold change and S.E.M. Three independent experiments were performed and normalized to cdc-42. * indicates a p-value <0.05 (Student’s t-test). (F, G) hpk-1 is essential for increased lifespan of daf-15(RNAi) and let-363(RNAi)-treated animals, respectively. Tabulated lifespan is provided in S1 Table.
Fig 11
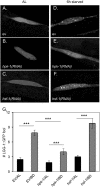
Fig 11. HPK-1 but not HSF-1 is essential for autophagosome formation.
(A-F) Inactivation of hpk-1 but not hsf-1 disrupts autophagosome formation after bacterial deprivation (BD) as visualized by puncta formation for the autophagosomal reporter Plgg-1::LGG-1::GFP (Atg8p/MAP-LC3) [18]. (G) Quantification of LGG-1:GFP foci in L3 stage animals under ad libitum (AL) and bacterial deprivation (BD) conditions. BD was imposed by removal from bacterial food for 6 hours prior to scoring puncta formation. Plotted are the mean number of LGG-1::GFP puncta/seam cell visualized +/-S.D. *** indicates a p-value of <0.001 (Student’s t-test). Summary data provided in S4 Table.
Fig 12
Fig 12. HPK-1 is essential for the transcriptional activation of autophagy.
(A) hpk-1 is necessary for the induction the autophagy genes atg-18 and bec-1 (Beclin1) in response to inactivation of TORC1 by daf-15(RNAi) (** indicates p<0.01, Student’s t-test). (B) In contrast, decreased TORC1 signaling represses the expression of the translation initiation factor genes ifg-1 and iftb-1 independently from hpk-1. (C) Similarly, TORC1 inhibition mildly induces hsp-16.2 and hsp-70 independently from hpk-1. Columns labeled hpk-1 indicate hpk-1(pk1393). Expression levels are presented as fold change +/- S.D. normalized to cdc-42 and averaged across four independent experiments.
Fig 13
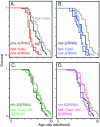
Fig 13. pha-4 and mxl-2 are required for hpk-1 to promote longevity.
(A) Overexpression of hpk-1 increases lifespan (grey versus black) and is pha-4 dependent (red traces). (B) Overexpression of hpk-1 increases lifespan dependent on mxl-2 (blue traces). (C) Loss of hlh-30 (green traces) partially suppresses the increased lifespan of hpk-1, consistent with parallel signaling or independence. (D) Loss of nhr-62 (pink/purple traces) has a minimal negative effect on both normal and the increased lifespan conferred by hpk-1 overexpression. In all cases, black traces are N2 and grey traces are Psur-5::HPK-1::CFP animals treated on control RNAi. For each panel, darker colored traces are respective RNAi-treatment of N2 animals and lighter colored traces are RNAi treatment of Psur-5::HPK-1::CFP animals. In some cases, experiments shown within this figure were performed simultaneously and split into multiple figures for readability. Full lifespan data can be found in S1 Table.
Fig 14
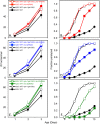
Fig 14. pha-4 and mxl-2 intersect with hpk-1 in the maintenance of proteostasis.
(A-B) Loss of pha-4 (red traces) does not increase foci formation (A) or the onset of paralysis (B) in the absence of hpk-1 (open circles/squares). (C-D) Loss of mxl-2 (blue traces) does not increase foci formation (C) or the onset of paralysis (D) in the absence of hpk-1 (open circles/squares). (E-F) Loss of hlh-30 (green traces) does not increase foci formation (E) but delays the onset of paralysis in the absence of hpk-1 (F) (open circles/squares). For foci formation, data are the mean and standard error of the mean (S.E.M.) of at least 15 animals from one representative trial; three independent experiments were performed. ***, **, and * indicate p-values of <0.001, <0.01, and <0.05, respectively. For paralysis, data is representative of one of two trials performed with the same conditions. See S3 Table for additional details.
Fig 15
Fig 15. HPK-1 delays aging and maintains proteostasis by potentiating TORC1 mediated autophagy and blocking HSF-1 inactivation through sumoylation.
Model of HPK-1 functions in longevity control: HPK-1 functions as a central hub to maintain proteostasis by preventing sumoylation and inactivation of HSF-1 and by stimulating the expression of autophagy genes by pha-4 and mxl-2. TORC1 inhibits hpk-1 expression to limit the induction of autophagy genes under basal conditions. Under nutrient stress, TORC1 is inactivated resulting in increased hpk-1 expression, which promotes autophagy gene expression through PHA-4/FoxA and MXL-2/Mlx. Thermal stress increases HPK-1 protein levels to reduce the threshold of activation of the heat shock response, and HPK-1 promotes longevity through modulation of HSF-1 activity under normal growth conditions.

Similar articles

Cited by

References

    1. Kenyon CJ. The genetics of ageing. Nature. 2010;464(7288):504–12. doi: 10.1038/nature08980 . - DOI - PubMed
    1. Blackwell TK, Steinbaugh MJ, Hourihan JM, Ewald CY, Isik M. SKN-1/Nrf, stress responses, and aging in Caenorhabditis elegans. Free Radic Biol Med. 2015;88(Pt B):290–301. doi: 10.1016/j.freeradbiomed.2015.06.008 - DOI - PMC - PubMed
    1. DiLoreto R, Murphy CT. The cell biology of aging. Mol Biol Cell. 2015;26(25):4524–31. doi: 10.1091/mbc.E14-06-1084 - DOI - PMC - PubMed
    1. Mair W, Dillin A. Aging and survival: the genetics of life span extension by dietary restriction. Annu Rev Biochem. 2008;77:727–54. Epub 2008/04/01. doi: 10.1146/annurev.biochem.77.061206.171059 . - DOI - PubMed
    1. Riera CE, Dillin A. Emerging Role of Sensory Perception in Aging and Metabolism. Trends Endocrinol Metab. 2016;27(5):294–303. doi: 10.1016/j.tem.2016.03.007 . - DOI - PubMed

MeSH terms

Substances

LinkOut - more resources

  NODES
INTERN 1
twitter 2