The prevalence and long-term variation of hospital readmission for patients with diabetes in Tianjin, China: A cross-sectional study
- PMID: 29049189
- PMCID: PMC5662355
- DOI: 10.1097/MD.0000000000007953
The prevalence and long-term variation of hospital readmission for patients with diabetes in Tianjin, China: A cross-sectional study
Abstract
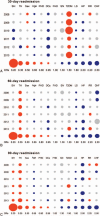
Little is known about hospital readmission for patients with diabetes in China. We aimed to assess the temporal pattern, risk factors, and variations of all-cause readmission among hospitalized patients with diabetes in Tianjin, China, from 2008 to 2013.The Tianjin Basic Medical Insurance Register System database was used to identify discharged patients with diabetes from 2008 to 2013. The influential factors and trends of rehospitalization were analyzed for 30-, 60- and 90-day predicted readmission rates. The Blinder-Oaxaca decomposition was used to explain the readmission variations between 2008 and 2013.The long stay-time at the index hospitalization is a shared risk factor for readmission at 30, 60, and 90 days each year. The 90-day predicted readmission rates were the highest for each year (all P < .001). The adjusted readmission rates generally decreased by year (all P < .001), except for at the 90-day interval, which decreased in 2010 and slightly increased in 2013 (from 7.47% in 2012 to 7.65% in 2013). If the patients had been readmitted to the hospital in 2013 and the only changes that had occurred since 2008 were observable characteristics, then the readmission rates would have decreased by 0.84%, 0.27%, and 0.18% at 30, 60, and 90 days, respectively. The potential policy changes decreased the readmission rates at 1.35%, 2.01%, and 1.04% for the 3 intervals, respectively.Identifying _targeted factors for the decrease in readmission rates may help to control readmission, particularly for long-interval patients.
Conflict of interest statement
The authors report no conflicts of interest.
Figures


Similar articles
-
Prevalence and temporal pattern of hospital readmissions for patients with type I and type II diabetes.BMJ Open. 2015 Nov 2;5(11):e007362. doi: 10.1136/bmjopen-2014-007362. BMJ Open. 2015. PMID: 26525716 Free PMC article.
-
Association of Hospital Discharge Against Medical Advice With Readmission and In-Hospital Mortality.JAMA Netw Open. 2020 Jun 1;3(6):e206009. doi: 10.1001/jamanetworkopen.2020.6009. JAMA Netw Open. 2020. PMID: 32525546 Free PMC article.
-
National trends in emergency readmission rates: a longitudinal analysis of administrative data for England between 2006 and 2016.BMJ Open. 2018 Mar 12;8(3):e020325. doi: 10.1136/bmjopen-2017-020325. BMJ Open. 2018. PMID: 29530912 Free PMC article.
-
Relationship between insurance and 30-day readmission rates in patients 65 years and older discharged from an acute care hospital with hospice services.J Hosp Med. 2016 Oct;11(10):688-693. doi: 10.1002/jhm.2613. Epub 2016 May 25. J Hosp Med. 2016. PMID: 27222206 Review.
-
The effect of diabetes on hospital readmissions.J Diabetes Sci Technol. 2012 Sep 1;6(5):1045-52. doi: 10.1177/193229681200600508. J Diabetes Sci Technol. 2012. PMID: 23063030 Free PMC article. Review.
Cited by
-
Predictors of 30-day unplanned hospital readmission among adult patients with diabetes mellitus: a systematic review with meta-analysis.BMJ Open Diabetes Res Care. 2020 Aug;8(1):e001227. doi: 10.1136/bmjdrc-2020-001227. BMJ Open Diabetes Res Care. 2020. PMID: 32784248 Free PMC article. Review.
-
Electronic medical record-based model to predict the risk of 90-day readmission for patients with heart failure.BMC Med Inform Decis Mak. 2019 Oct 15;19(1):193. doi: 10.1186/s12911-019-0915-8. BMC Med Inform Decis Mak. 2019. PMID: 31615569 Free PMC article.
-
Association between the Charlson Comorbidity Index and the risk of 30-day unplanned readmission in patients receiving maintenance dialysis.BMC Nephrol. 2019 Oct 7;20(1):363. doi: 10.1186/s12882-019-1538-0. BMC Nephrol. 2019. PMID: 31590637 Free PMC article.
-
The prevalence of pre-diabetes and diabetes and their associated factors in Northeast China: a cross-sectional study.Sci Rep. 2019 Feb 21;9(1):2513. doi: 10.1038/s41598-019-39221-2. Sci Rep. 2019. PMID: 30792436 Free PMC article.
References
-
- Morganstein DL, Tan S, Gore M, et al. Prevalence of diabetes in patients admitted to a cancer hospital. Br J Diabetes Vasc Dis 2012;12:178–80.
-
- Zuckerman RB, Sheingold SH, Orav EJ, et al. Readmissions, observation, and the hospital readmissions reduction program. N Engl J Med 2016;374:1543–51. - PubMed
-
- Epstein AM, Jha AK, Orav EJ. The relationship between hospital admission rates and rehospitalizations. N Engl J Med 2011;365:2287–95. - PubMed
Publication types
MeSH terms
LinkOut - more resources
Full Text Sources
Other Literature Sources
Medical

