Microcirculatory disturbances and cellular changes during progression of hepatic steatosis to liver tumors
- PMID: 29065724
- PMCID: PMC5788156
- DOI: 10.1177/1535370217738730
Microcirculatory disturbances and cellular changes during progression of hepatic steatosis to liver tumors
Abstract
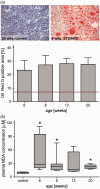
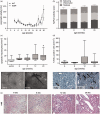
Non-alcoholic fatty liver disease is closely associated with metabolic syndrome and comprises a pathological spectrum of liver disease ranging from steatosis to steatohepatitis and can progress to fibrosis/cirrhosis and hepatocellular carcinoma. In 2013, a mouse model was described that mimics non-alcoholic fatty liver disease progression from steatohepatitis to tumors in a short time span and with high incidence. As microcirculatory disturbances play a crucial role in liver disease, the suitability of the steatosis-inflammation-tumor model for microcirculatory studies was assessed. Herein, we present a comprehensive view on morphological, microvascular, cellular, and functional aspects of non-alcoholic fatty liver disease progression in the steatosis-inflammation-tumor model using intravital microscopy, biochemical, and histological techniques. Mice develop steatohepatitis, mild fibrosis, and liver tumors at ages of 6, 12, and 20 weeks, respectively. Non-alcoholic fatty liver disease progression was accompanied by several general aspects of disease severity like increasing liver/body weight index, non-alcoholic fatty liver disease activity score, and hepatocellular apoptosis. Intravital microscopic analysis revealed significant changes in hepatic microcirculation with increasing structural alterations, elevated leukocyte adherence, and impaired nutritive perfusion. Non-alcoholic fatty liver disease was further characterized by a lower sinusoidal density with a striking rise at 20 weeks. The characteristic microcirculatory changes make the model a convenient tool for analysis of microcirculation during progression from steatosis to liver tumor. Impact statement Significant alterations of microcirculation contribute to progression of NAFLD, a chronic liver disease with increasing medical and socio-economic impact. Characterization of microcirculation in a NAFLD model reflecting all relevant stages of disease progression was still missing. Thus, we evaluated microcirculatory and cellular changes in a steatosis-inflammation-tumor model using in vivo microscopy. Analyses revealed increasing structural alterations, elevated leukocyte-endothelial interaction, and impaired nutritive perfusion. Thus, this model is suitable for further studies investigating therapeutic approaches _targeting these progressive microcirculatory disturbances.
Keywords: Non-alcoholic fatty liver disease; hepatic microcirculation; hepatocellular carcinoma; intravital microscopy; steatohepatitis.
Figures


Similar articles
-
Progression of non-alcoholic steatosis to steatohepatitis and fibrosis parallels cumulative accumulation of danger signals that promote inflammation and liver tumors in a high fat-cholesterol-sugar diet model in mice.J Transl Med. 2015 Jun 16;13:193. doi: 10.1186/s12967-015-0552-7. J Transl Med. 2015. PMID: 26077675 Free PMC article.
-
Lipid-lowering agents inhibit hepatic steatosis in a non-alcoholic steatohepatitis-derived hepatocellular carcinoma mouse model.Eur J Pharmacol. 2016 Feb 5;772:22-32. doi: 10.1016/j.ejphar.2015.12.043. Epub 2015 Dec 24. Eur J Pharmacol. 2016. PMID: 26724391
-
Cholesterol Exacerbates the Pathophysiology of Non-Alcoholic Steatohepatitis by Upregulating Hypoxia-Inducible Factor 1 and Modulating Microcirculatory Dysfunction.Nutrients. 2023 Dec 8;15(24):5034. doi: 10.3390/nu15245034. Nutrients. 2023. PMID: 38140293 Free PMC article.
-
Translational approaches: from fatty liver to non-alcoholic steatohepatitis.World J Gastroenterol. 2014 Jul 21;20(27):9038-49. doi: 10.3748/wjg.v20.i27.9038. World J Gastroenterol. 2014. PMID: 25083077 Free PMC article. Review.
-
Non-alcoholic fatty liver disease: an emerging pathological spectrum.Virchows Arch. 2004 Jan;444(1):3-12. doi: 10.1007/s00428-003-0943-7. Epub 2003 Dec 18. Virchows Arch. 2004. PMID: 14685853 Review.
Cited by
-
The effect of different weight loss strategies to treat non-alcoholic fatty liver disease focusing on fibroblast growth factor 21.Front Nutr. 2022 Aug 10;9:935805. doi: 10.3389/fnut.2022.935805. eCollection 2022. Front Nutr. 2022. PMID: 36034917 Free PMC article.
-
Identification of common signature genes and pathways underlying the pathogenesis association between nonalcoholic fatty liver disease and atherosclerosis.Front Cardiovasc Med. 2023 Mar 30;10:1142296. doi: 10.3389/fcvm.2023.1142296. eCollection 2023. Front Cardiovasc Med. 2023. PMID: 37063958 Free PMC article.
-
Dietary-Induced Low-Grade Inflammation in the Liver.Biomedicines. 2020 Dec 9;8(12):587. doi: 10.3390/biomedicines8120587. Biomedicines. 2020. PMID: 33317065 Free PMC article.
-
Endogenously increased n-3 PUFA levels in fat-1 transgenic mice do not protect from non-alcoholic steatohepatitis.Hepatobiliary Surg Nutr. 2019 Oct;8(5):447-458. doi: 10.21037/hbsn.2019.04.03. Hepatobiliary Surg Nutr. 2019. PMID: 31673534 Free PMC article.
-
n-3 PUFAs reduce tumor load and improve survival in a NASH-tumor mouse model.Ther Adv Chronic Dis. 2019 Sep 5;10:2040622319872118. doi: 10.1177/2040622319872118. eCollection 2019. Ther Adv Chronic Dis. 2019. PMID: 31523414 Free PMC article.
References
-
- Dietrich P, Hellerbrand C. Non-alcoholic fatty liver disease, obesity and the metabolic syndrome. Best Pract Res Clin Gastroenterol 2014; 28:637–53 - PubMed
-
- World Health Organization. Global health estimates 2015: deaths by cause, age, sex, by country and by region, 2000–2015, Geneva.
-
- Day CP, James OF. Steatohepatitis: a tale of two ‘hits’? Gastroenterology 1998; 114:842–5 - PubMed
Publication types
MeSH terms
LinkOut - more resources
Full Text Sources
Other Literature Sources
Medical
Research Materials

