. 2017 Nov 21;21(8):2171-2182.
doi: 10.1016/j.celrep.2017.10.068.

S-Nitrosylation of PINK1 Attenuates PINK1/Parkin-Dependent Mitophagy in hiPSC-Based Parkinson's Disease Models

Affiliations

S-Nitrosylation of PINK1 Attenuates PINK1/Parkin-Dependent Mitophagy in hiPSC-Based Parkinson's Disease Models

Chang-Ki Oh et al. Cell Rep. .

Abstract

Mutations in PARK6 (PINK1) and PARK2 (Parkin) are linked to rare familial cases of Parkinson's disease (PD). Mutations in these genes result in pathological dysregulation of mitophagy, contributing to neurodegeneration. Here, we report that environmental factors causing a specific posttranslational modification on PINK1 can mimic these genetic mutations. We describe a molecular mechanism for impairment of mitophagy via formation of S-nitrosylated PINK1 (SNO-PINK1). Mitochondrial insults simulating age- or environmental-related stress lead to increased SNO-PINK1, inhibiting its kinase activity. SNO-PINK1 decreases Parkin translocation to mitochondrial membranes, disrupting mitophagy in cell lines and human-iPSC-derived neurons. We find levels of SNO-PINK1 in brains of α-synuclein transgenic PD mice similar to those in cell-based models, indicating the pathophysiological relevance of our findings. Importantly, SNO-PINK1-mediated deficits in mitophagy contribute to neuronal cell death. These results reveal a direct molecular link between nitrosative stress, SNO-PINK1 formation, and mitophagic dysfunction that contributes to the pathogenesis of PD.

Keywords: PARK2; PARK6; PINK1; Parkin; Parkinson’s disease; S-nitrosylation; mitophagy.


Figures

Figure 1
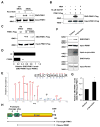
Figure 1. Endogenous PINK1 is S-Nitrosylated in Cultured Neural Cells and in a Transgenic PD Mouse Model
(A) SH-SY5Y cells were pre-incubated with 2.5 μM MG132 for 4 hr prior to incubation for 20 min in 200 μM SNOC (or, as a control, ‘old’ SNOC from which NO had been dissipated). Cell lysates were subjected to biotin-switch assay to detect endogenous SNO-PINK1. Negative controls were performed in the absence of ascorbate, which selectively reduces SNO. SNO-PINK1 and total (Input)-PINK1 were detected by immunoblot with anti-PINK1 antibody. (B) HEK-nNOS cells were transfected with wild-type (wt) PINK1-Flag. After 1 day, cells were incubated for 3 hr with 10 μM MG132 and A23187 in the presence or absence of 1 mM L-NNA. Cell lysates were then subjected to biotin-switch assay, immunoblotted, and probed with anti-Flag antibody. (C) SH-SY5Y cells were transfected with wt PINK1-Flag or mutant PINK1(C568A)-Flag. After 1 day, cells were pre-treated with 10 μM MG132 for 4 hr and then incubated in 200 μM fresh or old SNOC for 20 min. Cell lysates were subjected to biotin-switch assay and immunoblotted with anti-Flag antibody. (D) Ratio of SNO-PINK1/Input (total) PINK1 from wt or C568A mutant PINK1 transfected SH-SY5Y cells. Data are mean + SEM; ***p < 0.001; n = 3 experiments. (E) Mass spectrometry identification of Cys568 on human PINK1 as the site of S-nitrosylation after labeling with biotin (see Method Details). Fragmentation of the amide bonds of the peptide resulted in formation of ‘b’ and ‘y’ ion series corresponding to the N-terminal and C-terminal fragments, respectively. All fragments have a charge of +1. The spectrum indicates that Cys568 indicated as C* possesses a 428.1916 mass shift, which corresponds to the addition of biotin. Manual validation of the spectra was performed to determine the source of the large peaks that were un-assigned by the software: The peak at 463(***) is the c4 ion with loss of the biotin modification; 429 peak (**) is the c4 ion with the loss of biotin as well as H2S from the side chain of cysteine; 714 peak (#) represents charge +2 of the y9 ion; the 1056 peak(@) is the b10 ion with biotin. (F and G) Ratio of SNO-PINK1 to total PINK1 in a transgenic PD mouse model. Brain lysates from 4-month-old control or human α-synuclein—overexpressing mice were subjected to biotin-switch assay, followed by immunoblotting with anti-PINK1, anti-α-synuclein, and anti-Parkin antibodies (F). Ratio of SNO-PINK1/Input (total) PINK1 from mouse brains (G). Data are mean + SEM; *p < 0.05; n = 4 experiments. (H) Schematic drawing showing PINK1 protein. MTS, mitochondria-_targeting sequence; TM, transmembrane domain.
Figure 2
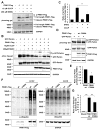
Figure 2. S-Nitrosylation of PINK1 Decreases Its Kinase Activity
(A) SH-SY5Y cells were transfected with wt PINK1-Flag. After 1 day, cells were exposed to 10 μM CCCP in the presence or absence of 200 μM SNOC. Ninety minutes later, cell lysates were subjected to phos-tag SDS-PAGE to detect auto-phosphorylated PINK1 with anti-Flag antibody (upper panel). Open arrow indicates phosphorylated PINK1. Immunoblot of PINK1-Flag and GAPDH using standard SDS-PAGE (lower panels). (B) SH-SY5Y cells were transfected with wt PINK1-Flag and GFP-Parkin. After 1 day, cells were exposed to 10 μM CCCP in the presence or absence of 200 μM SNOC. Ninety minutes later, cell lysates were subjected to phos-tag SDS-PAGE and immunoblotting with anti-Parkin or anti-Flag antibody. Open arrow indicates phosphorylated Parkin. (C) Phosphorylated Parkin normalized to total PINK1 from immunoblots. Data are mean + SEM; **p < 0.01 by ANOVA; n = 3 experiments. (D) SH-SY5Y cells were transfected with GFP-Parkin plus wt PINK1-Flag or mutant PINK1(C568A)-Flag. The amount of transfected plasmid DNA was adjusted to produce equal expression of wt and mutant PINK1. After 1day, cells were lysed and subjected to phos-tag SDS-PAGE and standard immunoblotting with anti-Parkin or anti-Flag antibody. (E) Phosphorylation of Parkin normalized to total PINK1 from immunoblots. Data are mean + SEM; *p < 0.05; n = 3 experiments. (F) SH-SY5Y cells were transfected with wt PINK1-Flag or mutant PINK1(C568A)-Flag. After 1 day, cells were exposed to 10 μM CCCP for 3 hr. Cell lysates were subjected to immunoblotting with anti-ubiquitin, p-ubiquitin, Flag, or GAPDH antibodies. (G) Phosphorylation of ubiquitin normalized to total Ubiquitin from immunoblots. Data are mean + SEM; ***p < 0.001; n = 3 experiments.
Figure 3
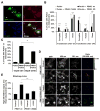
Figure 3. S-Nitrosylation of PINK1 Decreases PINK1/Parkin-Mediated Mitophagy
(A) SH-SY5Y cells were transfected with GFP-Parkin and wt PINK1-tomato. After 1 day, cells were fixed with 4% PFA and immunostained with anti-Tom20 antibody (blue). Arrows indicate complete translocation, and arrowheads indicate partial translocation of GFP-Parkin to the mitochondrial membrane. Scale bar, 20 μm. (B) SH-SY5Y cells were transfected with GFP-Parkin and wt-, non-nitrosylatable C568A, or kinase dead (KD) PINK1-Flag. After 6 or 24 hr, cells were scored for complete, partial, or no translocation of GFP-Parkin to mitochondria (See Figure S5A). Data are mean + SEM; ***p < 0.001; **p < 0.01 by ANOVA; n = 3 experiments. (C) SH-SY5Y cells were transfected with GFP-Parkin and wt PINK1-Flag. After 6 hr, cells were exposed to 100 μM GSNO or GSH control, and then incubated an additional 24 hr. Cells with complete translocation of GFP-Parkin to the mitochondrial membrane were scored (See Figure S5D). Data are mean + SEM; **p < 0.01 by ANOVA; n = 3 experiments. (D) SH-SY5Y cells were transfected with mt-Keima and wt PINK1-GFP or mutant PINK1(C568A)-GFP. After 1 day, cells were exposed to 20 μM CCCP for 16 hr. Cells were then imaged with 458 nm (measuring mitochondria with neutral pH) and 561 nm (measuring mitochondria with acidic pH) laser excitation for mt-Keima (emission at 610 nm) and at 488 nm for GFP (emission at 530 nm). mt-Keima can be used to differentially label mitochondria localized in the cytoplasmic (458 nm) and lysosomal (561 nm) compartments. Thus, a high ratio of mt-Keima-derived florescence (561 nm/458 nm), originating from low pH compartments, i.e., mitochondria within lysosomes, appears as red. Scale bar, 20 μm. (E) Quantification of mitophagy index, derived as the proportion of high-ratio signal area (561 nm/458 nm) to total mitochondrial area (561 nm plus 458 nm) from three random fields in each experiment. Data are mean + SEM; ***p < 0.001 by ANOVA; n = 3 experiments.
Figure 4
Figure 4. Endogenous PINK1 Levels and Mitophagy in hiPSC-DA Neurons as a Model for Human PD
(A) Lysates of SH-SY5Y cells, wt hiPSC-DA neurons, A53T mutant α-synuclein hiPSC-DA neurons, control human postmortem brain, and wt mouse brain were immunoblotted for PINK1, Parkin and GAPDH. The differentiation of hiPSCs into DA neurons was verified as previously described.(Ryan et al., 2013) Abbreviations: hPINK1, human PINK1; mPINK1, mouse PINK1. (BD) hiPSC-DA neurons were exposed to 1 μM valinomycin for 9 hr. Cell lysates were immunoblotted for PINK1, ubiquitin, phospho-ubiquitin and GAPDH. Phosphorylation of ubiquitin levels were normalized to total ubiquitin (D). Data are mean + SEM; ***p < 0.001; **p < 0.01; n = 3 experiments.
Figure 5
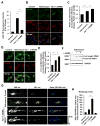
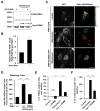
Figure 5. Mitochondrial Insult Induces Mitophagy in hiPSC-DA Neurons
(A) hiPSC-DA neurons were exposed for 9 hr to 1 μM valinomycin in the presence or absence of 1 mM L-NAME. To monitor NO, cells were incubated with 2.5 μM DAF-FM for 30 min. Data are mean + SEM from five random fields in each experiment; ***p < 0.001 by ANOVA; n = 3 experiments. (B) hiPSC-DA neurons were exposed for 9 hr to 250 nM valinomycin in the presence or absence of 1 mM L-NAME, and immunostained for Parkin and Tom20. Scale bar, 20 μm. (C) Parkin translocation to the mitochondrial membrane assessed by co-localization with Tom20. Data are mean + SEM from three random fields in each experiment; ***p < 0.001; **p < 0.01 by ANOVA; n = 3 experiments. (D) hiPSC-DA neurons were exposed for 9 hr to 250 nM valinomycin in the presence or absence of 1 mM L-NAME, and then immunostained for LC3 and Tom20. Scale bar, 10 μm. (E) LC3 translocation to the mitochondrial membrane assessed by co-localization with Tom20. Data are mean + SEM from three random fields in each experiment; ***p < 0.001; **p < 0.01 by ANOVA; n = 3 experiments. (F) hiPSC-DA neurons were exposed for 9 hr to 1 μM valinomycin in the presence or absence of 1 mM L-NAME; lysates were then immunoblotted for PINK1 and GAPDH. (G) hiPSC-DA neurons were electroporated with mt-Keima. Transfected cells were exposed to 250 nM valinomycin for 16 hr in the presence or absence of L-NAME, and imaged following excitation at 458 nm and 561 nm. After obtaining an initial set of images (top three rows), 50 mM NH4Cl was added to neutralize the pH in the lysosomal lumen before acquiring a second set of images (bottom row); this reversed the high-ratio (561 nm/458 nm) to low-ratio signal (Bingol et al., 2014). Scale bar, 10 μm. (H) Quantification of mitophagy index in three random fields in each experiment. Data are mean + SEM; ***p < 0.001; *p < 0.05 by ANOVA; n = 3 experiments.
Figure 6
Figure 6. S-Nitrosylation of PINK1 Decreases Mitophagy in hiPSC-DA Neurons Exposed to Valinomycin
(A) hiPSC-DA neurons were exposed to 250 nM valinomycin for 3 hr. Cell lysates were then subjected to biotin-switch assay to detect endogenous SNO-PINK1. Control was performed in the absence of ascorbate. SNO-PINK1 and Input-PINK1 were detected by immunoblotting with anti-PINK1 antibody. (B) Ratio of SNO-PINK1/Input-PINK1 from hiPSC-DA neurons. Data are mean + SEM; **p < 0.01; n = 3 experiments. (C) hiPSC-DA neurons were electroporated with mt-Keima and wt PINK1-GFP or mutant PINK1(C568A)-GFP. Subsequently, transfected cells were exposed to 250 nM valinomycin for 16 hr and imaged for mt-Keima and GFP. Scale bar, 20 μm. (D) Mitophagy index determined from three random fields in each experiment. Data are mean + SEM; ***p < 0.001 by ANOVA; n = 3 experiments. (E and F) hiPSC-DA neurons were exposed for 9 hr to 250 nM valinomycin in the presence or absence of 1 mM L-NAME. Cells were then fixed with 4% PFA and assayed for apoptotic neurons by TUNEL (total number of cells was assessed by Hoechst nuclear staining [E], see Figure S6A) and by the presence of condensed nuclei stained with Hoechst dye (F). Data are mean + SEM from three random fields in each experiment; ***p < 0.001 by ANOVA; n = 3 experiments.
Figure 7
Figure 7. Proposed Model Illustrating SNO-PINK1-Mediated Inhibition of Mitophagy
Dissipation of mitochondrial membrane potential stabilizes PINK1 on the mitochondrial membrane. The accumulated PINK1 phosphorylates Parkin and other substrates, facilitating lysosome-dependent degradation of damaged mitochondria (mitophagy). Low levels of NO can enhance mitophagy, possibly via SNO-Parkin-mediated pathways. In contrast, under conditions causing nitrosative stress, excessively produced NO can S-nitrosylate PINK1, inhibit its kinase activity, and decrease translocation of Parkin to mitochondria. This leads to accumulation of damaged mitochondria and increased cell death, contributing to the pathogenesis of neurodegenerative diseases such as PD.

Similar articles

Cited by

References

    1. Bazan NG. Cell survival matters: docosahexaenoic acid signaling, neuroprotection and photoreceptors. Trends Neurosci. 2006;29:263–271. - PubMed
    1. Bingol B, Tea JS, Phu L, Reichelt M, Bakalarski CE, Song Q, Foreman O, Kirkpatrick DS, Sheng M. The mitochondrial deubiquitinase USP30 opposes Parkin-mediated mitophagy. Nature. 2014;510:370–375. - PubMed
    1. Chung KK, Thomas B, Li X, Pletnikova O, Troncoso JC, Marsh L, Dawson VL, Dawson TM. S-Nitrosylation of parkin regulates ubiquitination and compromises parkin’s protective function. Science. 2004;304:1328–1331. - PubMed
    1. Cociorva D, DLT, Yates JR. Validation of tandem mass spectrometry database search results using DTASelect. Curr Protoc Bioinformatics. 2007;Chapter 13(Unit 13):14. - PubMed
    1. de Vries RL, Przedborski S. Mitophagy and Parkinson’s disease: be eaten to stay healthy. Mol Cell Neurosci. 2013;55:37–43. - PubMed

Supplementary concepts

LinkOut - more resources

  NODES
twitter 2