. 2018 Feb 7;38(6):1520-1540.
doi: 10.1523/JNEUROSCI.1688-17.2017. Epub 2018 Jan 5.

Nonselective Wiring Accounts for Red-Green Opponency in Midget Ganglion Cells of the Primate Retina

Affiliations

Nonselective Wiring Accounts for Red-Green Opponency in Midget Ganglion Cells of the Primate Retina

Lauren E Wool et al. J Neurosci. .

Abstract

In primate retina, "red-green" color coding is initiated when signals originating in long (L) and middle (M) wavelength-sensitive cone photoreceptors interact antagonistically. The center-surround receptive field of "midget" ganglion cells provides the neural substrate for L versus M cone-opponent interaction, but the underlying circuitry remains unsettled, centering around the longstanding question of whether specialized cone wiring is present. To address this question, we measured the strength, sign, and spatial tuning of L- and M-cone input to midget receptive fields in the peripheral retina of macaque primates of either sex. Consistent with previous work, cone opponency arose when one of the cone types showed a stronger connection to the receptive field center than to the surround. We implemented a difference-of-Gaussians spatial receptive field model, incorporating known biology of the midget circuit, to test whether physiological responses we observed in real cells could be captured entirely by anatomical nonselectivity. When this model sampled nonselectively from a realistic cone mosaic, it accurately reproduced key features of a cone-opponent receptive field structure, and predicted both the variability and strength of cone opponency across the retina. The model introduced here is consistent with abundant anatomical evidence for nonselective wiring, explains both local and global properties of the midget population, and supports a role in their multiplexing of spatial and color information. It provides a neural basis for human chromatic sensitivity across the visual field, as well as the maintenance of normal color vision despite significant variability in the relative number of L and M cones across individuals.SIGNIFICANCE STATEMENT Red-green color vision is a hallmark of the human and nonhuman primate that starts in the retina with the presence of long (L)- and middle (M)-wavelength sensitive cone photoreceptor types. Understanding the underlying retinal mechanism for color opponency has focused on the broad question of whether this characteristic can emerge from nonselective wiring, or whether complex cone-type-specific wiring must be invoked. We provide experimental and modeling support for the hypothesis that nonselective connectivity is sufficient to produce the range of red-green color opponency observed in midget ganglion cells across the retina. Our nonselective model reproduces the diversity of physiological responses of midget cells while also accounting for systematic changes in color sensitivity across the visual field.

Keywords: circuitry; color; ganglion cell; primate; retina; vision.


Figures

Figure 1.
Figure 1.
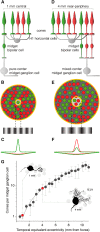
Midget circuitry in fovea and periphery. A, A midget ganglion cell in the fovea (<1 mm eccentricity) is characterized by “private-line” circuitry: a receptive field center comprises a single cone connected via a single midget bipolar cell, whereas the receptive field surround has broad, indiscriminate L- and M-cone inputs via H1 horizontal cells. B, This example cell shows a peak spatial frequency tuning on the order of a single cone. C, The single M-cone center has a response profile opposite that of the mixed L- and M-cone inputs to the receptive field surround, which is sufficient to drive an L–M cone-opponent response. D, The receptive field center of a more peripheral midget cell (4 mm eccentricity) no longer exhibits private-line circuitry, as multiple cone-bipolar inputs converge onto the larger midget ganglion cell dendritic field. H1 inputs to the receptive field surround also increase. E, A larger receptive field center shows reduced spatial frequency tuning. F, Mixed L and M inputs to center and surround response profiles diminish the likelihood of cone-opponent sensitivity. G, The convergence of cones to the midget dendritic field increases monotonically with eccentricity and can be fit with the function y = 0.29x2 + 0.83x − 0.28. Inset, Example midgets from 1 and 4 mm eccentricity, along with their sampling of the underlying cone mosaic. Error bars indicate SEM. Adapted with permission from Crook et al. (2014).
Figure 2.
Figure 2.
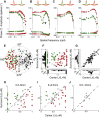
Chromatic and achromatic receptive field characteristics. Cone-isolating stimuli revealed chromatic midget cells with cone-opponent responses or achromatic midgets cells, which resembled parasol cells in their lack of cone-opponent responses. A, B, Chromatic midgets (n = 96) either comprised a single cone type (A) or were strongly weighted toward one cone type (B) in the receptive field center, whereas receptive field surrounds were always a mix of L and M inputs. Insets, Illustrative difference-of-Gaussians. A, An example OFF midget cell with pure L input to the center exhibited a bandpass L-cone response in the OFF phase (red), whereas M cones, present only in the surround, drove a low-pass response in the opposite ON phase (green). B, An example OFF midget cell with dominant L input to the center also showed a bandpass L-cone response in the OFF phase (red), whereas the M-cone spatial tuning curve (green) exhibited phase-reversing behavior. A weak M-cone contribution to the OFF center was observable in phase with the dominant L input at high spatial frequencies, but the stronger M-cone contribution to the surround produced a response null (arrowhead) and a reversal to the ON phase at lower spatial frequencies. C, D, Achromatic midgets (C) showed mixed L and M inputs to both center and surround and exhibited in-phase, bandpass tuning for both L- and M-cone stimuli across all spatial frequencies. Similarly, parasol cells (D) showed mixed L and M inputs to both center and surround, albeit with lower spatial frequency cutoffs. Insets, Illustrative difference-of-Gaussians. E, Chromatic cells (red, green) were characterized by an L–M phase difference of ∼180°, whereas achromatic (gray) and parasol cells (black) were characterized by a phase difference of ∼0°. While the phase difference was stereotyped across cells with and without a cone-opponent response, cells rarely responded equally to L- and M-cone-isolating stimuli; various response ratios between the two stimuli suggest various distributions of L- and M-cone inputs to receptive fields. F, For chromatic midgets, plotting the cone purity index of the receptive field center (x axis) versus surround (y axis) shows a disparity between center and surround cone weights, indicated by points below (L-dominated centers, red) or above (M-dominated centers, green) the diagonal. Example cells from A and B are labeled. G, Both achromatic midgets (gray) and parasols (black) show balanced cone purity index values between center and surround, indicated by clustering along the diagonal. Example cells from C and D are labeled. H–J, A subset of midget cells where eccentricity was recorded (n = 118) is plotted as a function of eccentricity. Chromatic cells, with unequal cone purity index values, are more likely in nearer retinal locations (H), whereas intermediate (I) and far peripheral (J) locations show a greater proportion of achromatic cells with balanced cone purity index values.
Figure 3.
Figure 3.
Both chromatic and achromatic midgets respond to high-spatial frequency achromatic stimuli. A, Chromatic midget cells (n = 24) are highly sensitive to L + M contrast at the peak spatial frequency, showing robust, saturating contrast response curves. The mean firing rate of all cells at each contrast (2%–45%) is plotted (black circles). Error bars indicate SD. Each cell's contrast response curve was fitted with a Naka–Rushton function of three parameters: Rmax, C50, and b. The average fit of all cells (with parameters Rmax = 86.6 spikes s−1, C50 = 32.7%, b = 0.83 spikes s−1) is shown (solid line). B, Achromatic midgets (n = 34) are also highly sensitive to L + M contrast at the peak spatial frequency. Mean firing rates are plotted as in A, along with the average Naka–Rushton fit (Rmax = 101 spikes s−1, C50 = 31.5%, b = 0.51 spikes s−1). C, The contrast response functions for parasol cells (n = 14) have a higher response gain than midget cells, but similar saturating behavior over the contrast range. Mean firing rates are plotted as in A, along with the average Naka–Rushton fit (Rmax = 144 spikes s−1, C50 = 31.3%, b = 2.3 spikes s−1). Comparing the C50 fit parameters for all cells shows that the degree of contrast-response compression is not significantly different across cell types (one-way ANOVA, p = 0.75).
Figure 4.
Figure 4.
Bootstrap analysis confirms center-surround disparity in chromatic cells. For 168 midget cells, spike trains of L- and M-cone spatial tuning curves were bootstrapped 1000 times. Each bootstrapped tuning curve was then fitted with a difference-of-Gaussians function, from which the relative L- and M-cone weight parameters were retrieved and a cone purity index to center and surround recomputed. A–D, Examples of refitted bootstrapped spatial tuning curves are shown for three chromatic cells (A–C) and one achromatic cell (D). E, The cone purity index to center versus surround, computed for each bootstrap, is plotted for each cell. F, Center versus surround cone purity index for all bootstraps of M-dominated (green) and L-dominated (red) chromatic cells. Index values to center (0.57 ± 0.36, x axis histogram) versus surround (0.49 ± 0.24, y axis histogram) showed the same pattern of disparity as the original fits of chromatic cells, illustrated by plotted points above (green) or below (red) the diagonal. G, Center versus surround cone purity index for all bootstraps of achromatic cells. Equivalent cone purity index values between center (0.55 ± 0.18, x axis histogram) and surround (0.54 ± 0.21, y axis histogram), similar to the original fits of achromatic cells, are illustrated by a clustering of points along the diagonal.
Figure 5.
Figure 5.
Generating model receptive fields. A, A simulated patch of cone mosaic for a model cell at 5 mm eccentricity. The mosaic was generated on a triangular grid with random jitter; L and M cones were then randomly assigned. Overall L:M cone ratio for the patch was drawn from a distribution of ratios observed empirically, and cone density and diameter were assigned as a function of eccentricity. Receptive field size was also assigned as a function of eccentricity; this model cell's receptive field center (light gray circle) and surround (dark gray circle) are shown. B, To evaluate isolated L- and M-cone sensitivity, receptive field profiles for L and M inputs were separated and a difference-of-Gaussians kernel applied to weight the contribution of every cone in the receptive field. Heat maps illustrate the normalized strength of weighted L (top) and M (bottom) inputs to the cell's receptive field. Very strong inputs from 10 cones contribute to the receptive field center (red, yellow), whereas ∼350 cones comprise a much weaker input of the opposite sign to form the surround (dark blue). Color bars represent the normalized contribution of each cone ranges from approximately −0.05 (surround cones) to 0.12 (center cones). C, Fourier transforms of the spatial maps were used to evaluate the frequency tuning of L and M inputs to the cell. Response amplitude (top, L inputs; bottom, M inputs) and phase (data not shown) were determined from the real and imaginary components of the complex transform, respectively. Values were evaluated along a single axis, representing a continuous range of spatial frequencies (dotted line).
Figure 6.
Figure 6.
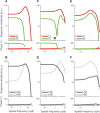
Chromatic and achromatic midget receptive fields are reproduced with a nonselective wiring model. Frequency analysis of receptive field inputs is shown for three model cells. Chromatic model midgets were composed of a single cone type (A, B) or were strongly biased toward one cone type (C, D) in the receptive field center, and showed mixed L and M inputs to the receptive field surround. A, An example model cell with pure L input to the center exhibited a bandpass L-cone response of one phase (red), whereas M-cones, present only in the surround, showed a low-pass response in the opposite phase (green). B, As such, this cell showed dominant opponent (L–M) sensitivity at low spatial frequencies (dark gray), with enhanced achromatic (L + M) sensitivity emerging at high spatial frequencies, with the isolation of the pure-cone center (light gray). C, An example model cell with dominant L inputs to center exhibited a bandpass L-cone response in one phase (red), whereas the M cone spatial tuning curve (green) exhibited phase-reversing behavior. A weak M-cone contribution to the center was in phase with the dominant L input at high spatial frequencies, but at lower spatial frequencies, the stronger M-cone contribution to the surround caused a response null (arrowhead) and a phase reversal. D, Like pure-center cells, these model chromatic cells also exhibited spatial-frequency-dependent chromatic and achromatic responses, showing dominant opponent (L–M) sensitivity at low spatial frequencies (dark gray) but enhanced achromatic sensitivity at high spatial frequencies (light gray). E, By comparison, achromatic model cells showed mixed L and M inputs to both the receptive field center and surround, and showed bandpass, in-phase tuning for L (red) and M (green) inputs across all spatial frequencies. F, Correspondingly, such cells showed weak L–M sensitivity (dark gray), and high L + M sensitivity (light gray) across all spatial frequencies, with no cone-opponent behavior.
Figure 7.
Figure 7.
L- versus M-cone disparity between receptive field center and surround determines cone opponency. Chromatic opponency is afforded to model cells with a sufficient cone disparity between center and surround. A, For chromatic model cells demonstrating cone opponency, plotting the cone purity index of center (x axis) versus surround (y axis) shows that all cells with L-dominated centers (red) fall below the diagonal, where M dominates to the surround. Conversely, cells with M-dominated centers (green) fall above the diagonal, where L dominates to the surround. Cone purity index values to center were highly variable and skewed toward 1 (pure L) or 0 (pure M). B, For achromatic model cells, plotting each cell's cone purity index to center (x axis) and surround (y axis) shows balanced L- and M-cone inputs between center and surround, indicated by points clustered along the diagonal. C–E, Binning model cells by eccentricity reveals more chromatic cells (with unequal cone purity index values) at near retinal locations (C), gradually supplanted by weakly chromatic and achromatic cells (more balanced cone purity index values) at intermediate (D) and far (E) eccentricities.
Figure 8.
Figure 8.
Effect of relative center-surround response gain on the generation of chromatic cells. A total of 5000 model cells were generated with a relative surround gain, ks, randomly assigned as 0.5–0.9 times the response gain of the center. Cells were binned as a function of their relative surround gain and cone purity index plotted for receptive field center (x axis) versus surround (y axis). A, Distribution of chromatic and achromatic cells with ks equal to 0.5–0.6 times that of the center; 30% of cells (379 of 1276) were chromatic. B, Distribution of chromatic and achromatic cells with ks equal to 0.6–0.7 times that of the center; 39% of cells (481 of 1251) were chromatic. C, Distribution of chromatic and achromatic cells with ks equal to 0.7–0.8 times that of the center; 48% (616 of 1291) of cells were chromatic. D, Distribution of chromatic and achromatic cells with ks equal to 0.8–0.9 times that of the center; 64% (757 of 1182) of cells were chromatic.
Figure 9.
Figure 9.
Effect of overall L:M cone ratio on the generation of chromatic cells. A total of 1500 model cells were generated for five different L:M-cone ratio ranges. Distribution of chromatic and achromatic cells from retinas with L:M ratios of (A) 5:1, (B) 2:1, (C) 1:1, (D) 1:2, and (E) 1:5 are plotted as described in Figures 7 and 8. Insets, Illustrative diagrams of L:M ratio. For each retina, the cone purity index in the surround exhibited low variance around a mean that closely reflected the overall L:M ratio (y axes). The distribution of center cone purity also reflected the overall L:M ratio for each retina, but exhibited higher variance, and so spanned the entire range from pure M (0) to pure L (1) for all conditions (x axes). Notably, chromatic and achromatic cells were generated in all conditions, regardless of L:M ratio.
Figure 10.
Figure 10.
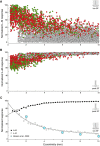
Chromatic and achromatic responses across eccentricity. A, Each model cell's opponent L–M responses at the lowest spatial frequency was plotted as a function of eccentricity. The density of chromatic cells (red, green) was highest closest to the fovea and exhibited the strongest opponent L–M responses. L–M responses decreased gradually with eccentricity, giving way to more achromatic cells (gray) in the periphery, with the lowest opponent L–M responses. B, Each model cell's response to L + M stimuli at the peak spatial frequency was plotted as a function of eccentricity. All model cells, both chromatic and achromatic, showed high L + M responses at high spatial frequencies, at all eccentricities. C, Model cells were binned across the eccentricity range (bin width = 0.25 mm); mean L–M response at the lowest spatial frequency (open circles) and mean L + M response at peak spatial frequency (closed circles) were computed and plotted as a function of eccentricity. Overall chromatic responses decline with increasing distance from fovea, whereas achromatic responses are consistently strong across all retinal locations. The decline in average chromatic strength is consistent with the decline of human L–M chromatic detection sensitivity measured psychophysically by Hansen et al. (2009) (blue circles). SF, Spatial frequency. Error bars indicate SEM.
Figure 11.
Figure 11.
The response continuum of model midget cells. Random variation in the receptive field profiles means that model cells generated for a single retina form a continuum of responses to L–M opponent stimuli. Drawn from cone mosaics with L:M ratios between 1:1 and 2.3:1, a subsample of 2154 model cells were plotted as a function of center cone purity index (x axis) versus surround cone purity index (y axis). The relatively small number of inputs to a midget-cell receptive field center underlies a large variance (0.61 ± 0.24) in cone purity index values, from pure M to pure L (left to right, respectively; x axis). The larger number of inputs to receptive field surrounds produces considerably less variance (0.61 ± 0.07), so the cone purity index is stable around a mean that reflects the L:M cone ratio of the sample cone mosaics (y axis). This combination produces a broad, continuous range of possible receptive field profiles (difference-of-Gaussians profiles, bottom inset) with highly variable centers and highly stable surrounds. Receptive fields with dominant L or M input to center show chromatic opponency, where one cone type dominates the center while the other cone type dominates the surround. These cells exhibit the strongest responses to L–M stimuli (saturated red and green points). Receptive fields with more balanced L and M to center do not show this disparity and thus show weak, or absent, opponency (desaturated red and green points). Because of the high variability of center inputs, most cells, regardless of opponency, have a small bias of either L or M to the center, thereby showing a residual response to L–M stimuli. The continuous distribution of possible L- and M-cone contributions to center and surround is randomly sampled to generate a heterogeneous population of chromatic and achromatic midget ganglion cells across the visual field.
Figure 12.
Figure 12.
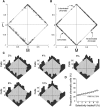
Comparison of model and empirical cells in the retinal periphery. Opponency in individual model cells was quantified by calculating the relative strengths of the total input from L and M cones across the entire receptive field, and the normalized weights [x axis, (MCMS)/(LT + MT); y axis, (LCLS)/(LT + MT)] were plotted as in Field et al. (2010; their Fig. 4H). Cells that plot in the first and third quadrants do not show cone-opponent responses, whereas cells located in the second and fourth quadrants do show cone-opponent responses. A, Chromatic and achromatic cells identified in a single recording at 6.75 mm temporal eccentricity, modified from Field et al. (2010, their Fig. 4H). A third axis quantifying the orthogonal departure of some cells from the L and M axes (illustrating putative S-cone input) has been removed for clarity. Sixty-three of 263 total midget cells (24%) showed L–M opponent responses, characterized by their location in the second and fourth quadrants. Notably, the opponent responses of these cells is weak, illustrated by an absence of cells at the midpoints of the diagonals (where L and M weights are equal and opposite) and a clustering of cells toward the x and y axis endpoints, where an overall L- or M-cone bias to the receptive field is demonstrated. B, In a population of model cells generated on the range of 6–8 mm eccentricity, 87 of 312 total cells (28%) were opponent, similarly demonstrating both an absence of strongly opponent cells at the midpoints of the diagonals and clusters of weakly opponent cells toward the x and y axis endpoints. C, D, To test the effects of synaptic strengthening as a mechanism for selectivity, the model population was subject to “tradeoff,” in which amplitude for the dominant cone type in the receptive field center was enhanced at the expense of the nondominant cone type. Tradeoff is represented as a percentage of the total response amplitude. C, As synaptic tradeoff increased, the number of chromatic cells in the population increased, indicated by the migration of cells from the first and third quadrants (achromatic) to the second and fourth quadrants (chromatic). Populations after adding 2%, 4%, 6%, 8%, and 10% selectivity are shown (histograms). Axes are the same as A and B. D, The effect of mild selectivity quickly produced model populations with higher proportions of chromatic cells that reported in the original model (0% selectivity tradeoff) or in Field et al. (2010, dashed line).

Similar articles

Cited by

References

    1. Anderson SJ, Mullen KT, Hess RF (1991) Human peripheral spatial resolution for achromatic and chromatic stimuli: limits imposed by optical and retinal factors. J Physiol 442:47–64. 10.1113/jphysiol.1991.sp018781 - DOI - PMC - PubMed
    1. Banks MS, Sekuler AB, Anderson SJ (1991) Peripheral spatial vision: limits imposed by optics, photoreceptors, and receptor pooling. J Opt Soc Am A 8:1775–1787. 10.1364/JOSAA.8.001775 - DOI - PubMed
    1. Baylor DA, Lamb TD, Yau KW (1979) Responses of retinal rods to single photons. J Physiol 288:613–634. 10.1113/jphysiol.1979.sp012716 - DOI - PMC - PubMed
    1. Baylor DA, Nunn BJ, Schnapf JL (1987) Spectral sensitivity of cones of the monkey Macaca fascicularis. J Physiol 390:145–160. 10.1113/jphysiol.1987.sp016691 - DOI - PMC - PubMed
    1. Benardete EA, Kaplan E (1999) Dynamics of primate P retinal ganglion cells: responses to chromatic and achromatic stimuli. J Physiol 519:775–790. 10.1111/j.1469-7793.1999.0775n.x - DOI - PMC - PubMed

Publication types

LinkOut - more resources

  NODES
twitter 2