. 2018 Feb 14;38(7):1802-1820.
doi: 10.1523/JNEUROSCI.1291-17.2018. Epub 2018 Jan 15.

Sox2 Is Essential for Oligodendroglial Proliferation and Differentiation during Postnatal Brain Myelination and CNS Remyelination

Affiliations

Sox2 Is Essential for Oligodendroglial Proliferation and Differentiation during Postnatal Brain Myelination and CNS Remyelination

Sheng Zhang et al. J Neurosci. .

Abstract

In the CNS, myelination and remyelination depend on the successful progression and maturation of oligodendroglial lineage cells, including proliferation and differentiation of oligodendroglial progenitor cells (OPCs). Previous studies have reported that Sox2 transiently regulates oligodendrocyte (OL) differentiation in the embryonic and perinatal spinal cord and appears dispensable for myelination in the postnatal spinal cord. However, the role of Sox2 in OL development in the brain has yet to be defined. We now report that Sox2 is an essential positive regulator of developmental myelination in the postnatal murine brain of both sexes. Stage-specific paradigms of genetic disruption demonstrated that Sox2 regulated brain myelination by coordinating upstream OPC population supply and downstream OL differentiation. Transcriptomic analyses further supported a crucial role of Sox2 in brain developmental myelination. Consistently, oligodendroglial Sox2-deficient mice developed severe tremors and ataxia, typical phenotypes indicative of hypomyelination, and displayed severe impairment of motor function and prominent deficits of brain OL differentiation and myelination persisting into the later CNS developmental stages. We also found that Sox2 was required for efficient OPC proliferation and expansion and OL regeneration during remyelination in the adult brain and spinal cord. Together, our genetic evidence reveals an essential role of Sox2 in brain myelination and CNS remyelination, and suggests that manipulation of Sox2 and/or Sox2-mediated downstream pathways may be therapeutic in promoting CNS myelin repair.SIGNIFICANCE STATEMENT Promoting myelin formation and repair has translational significance in treating myelin-related neurological disorders, such as periventricular leukomalacia and multiple sclerosis in which brain developmental myelin formation and myelin repair are severely affected, respectively. In this report, analyses of a series of genetic conditional knock-out systems _targeting different oligodendrocyte stages reveal a previously unappreciated role of Sox2 in coordinating upstream proliferation and downstream differentiation of oligodendroglial lineage cells in the mouse brain during developmental myelination and CNS remyelination. Our study points to the potential of manipulating Sox2 and its downstream pathways to promote oligodendrocyte regeneration and CNS myelin repair.

Keywords: Sox2; myelination and remyelination; oligodendrocyte differentiation; oligodendrocyte regeneration; oligodendroglial lineage progression; oligodendroglial progenitor cells.


Figures

Figure 1.
Figure 1.
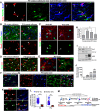
Sox2 is expressed in postnatal and adult OPCs and transiently upregulated in premyelinating OLs. A, Confocal images showing Sox2 expression in PDGFRα+ OPCs (arrowheads) and brain lipid basic protein (BLBP)+ astrocytic precursor cells (arrows) in the corpus callosum close to the subventricular zone on postnatal day P0, several days before the presence of differentiated OLs. B, Confocal images showing that Sox2 is expressed in PDGFRα+ OPCs in the brain corpus callosum at P5 (before OPC differentiation) and P14 (peak OPC differentiation) during developmental myelination. Arrowheads point to Sox2+PDGFRα+ OPCs. C, Confocal images showing that Sox2 is expressed in adult NG2+ OPCs at P60 (left panels, arrowheads) and that the expression is abolished in Sox2 cKO brain of P60 Pdgfrα-CreERT2, Sox2fl/fl mice that had been administered tamoxifen 5 d before tissue harvest (right panels, arrows). D, Double immunostaining of Sox2 and differentiated OL marker CC1 in forebrain corpus callosum and spinal cord. Arrowheads point to Sox2+CC1+ OLs. E, Confocal images showing Sox2 expression in myelin gene CNP- and MBP-positive differentiated OLs (arrowheads). Blue represents DAPI. F, G, Triple immunostaining of Sox2, CC1, and TCF7l2 in the corpus callosum (F) and spinal cord (G) showing that Sox2-expressing OLs (Sox2+CC1+) are TCF7l2+ newly differentiated OLs (TCF7l2+CC1+). Arrowheads are representative of the triple positive cells (Sox2+TCF7l2+CC1+). H–J, Sox2 mRNA (H) and protein (I) levels in purified, mouse primary OPCs and differentiating OLs at day 1 (D1), day 2 and day 4 (n = 3 at each time point). The differentiation of primary OPCs is verified by the sharp increase of MBP protein (I) and mRNA (J) from D1–D4. Sox2 protein expression is overlapped with TCF7l2 in differentiating OLs (I). K, L, Representative images of triple immunostaining of Sox2, TCF7l2, and PDGFRα in the forebrain corpus callosum (K) and quantification of corrected Sox2 fluorescence density in TCF7l2+ newly differentiated OLs and PDGFRα+ OPCs in P8 and P14 brains (L). K, Arrowheads and arrows point to Sox2+TCF7l2+ OLs and Sox2+PDGFRα+ OPCs, respectively. M, Schematic drawing illustrating Sox2 expression patterns along the progression and maturation of oligodendroglial lineage. OPC markers PDGFRα and NG2 are progressively downregulated, whereas OL markers CC1, proteolipid protein (Plp), MBP, and CNPase (CNP) are progressively upregulated. One-way ANOVA with Tukey's post hoc test (H) and two-tailed Student's t test (L): *p < 0.05; **p < 0.01; ***p < 0.001 (for the details of the statistical analyses for all figures, see Table 1). Scale bars: A–C, E, K, 10 μm; D, F, G, 20 μm.
Figure 2.
Figure 2.
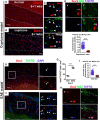
Cnp-Cre, Sox2fl/fl mice display brain hypomyelination on postnatal day 14. A, B, Grayscale images of MBP immunostaining showing decreased density of myelin fibers in the corpus callosum at the cingular cortical areas (A) and in the subcortical white matter tracts (B). C, Single and merged channels of confocal images of MBP and SMI312 in the subcortical white matter and the overlaying cortex. Most SMI312+ axons (green) lack MBP+ myelin (red) in the Cnp-Cre, Sox2fl/fl mice (lower right), in sharp contrast to extensive colabeling of MBP and SMI312 in the Sox2fl/fl littermate controls (top right). D, Quantification of relative densities of MBP and SMI312 immunoreactive signals (n = 4 Cnp-Cre, Sox2fl/fl, n = 5 Sox2fl/fl mice). **p < 0.01 (two-tailed Student's t test). E, Representative image of Western blotting analyses of Sox2 and MBP protein from Cnp-Cre, Sox2fl/fl (cKO) and Sox2fl/fl (WT) forebrains. β-actin serves as an internal loading control. F, High-power confocal images of MBP and SMI312 in the cortical areas of layers 5/6 of P14 Cnp-Cre, Sox2fl/fl and Sox2fl/fl control brains. Scale bars: B, 200 μm; C, 50 μm, F, 10 μm.
Figure 3.
Figure 3.
Oligodendrocyte differentiation is inhibited in the brain of Cnp-Cre Sox2fl/fl mice. A, Fate-mapping of Cnp-Cre-expressing cells in the subcortical white matter of P7 Cnp-Cre, Rosa-EYFP mice. Many PDGFRα+ OPCs are EYFP (arrowheads). B, Many EYFP+ fate-mapped cells are O4+ differentiation-committed, late OPCs, and/or immature oligodendrocytes (arrowheads) in the subcortical white matter of P7 Cnp-Cre, Rosa-EYFP mice. C, Triple immunostaining of CC1, PDGFRα, and Sox2 in the corpus callosum. Arrows and arrowheads point to representative CC1+ OLs and PDGFRα+ OPCs, respectively. In the Sox2 cKO corpus callosum (bottom), many OPCs retain Sox2 expression, whereas no OLs have detectable Sox2. D, Quantification of Olig2+CC1+ OLs and Olig2+PDGFRα+ OPCs in the subcortical white matter tract. Olig2 is a pan-oligodendroglial marker expressed in both OPCs and OLs. E, F, Density (cell no./mm2) (E) and representative images (F) of TCF7l2-expressing, newly differentiated OLs in the subcortical white matter tracts (F, dotted areas). C–F, Animals are P14 old. D, E, n = 4 Cnp-Cre Sox2fl/fl and n = 6 Sox2fl/fl. **p < 0.01 (two-tailed Student's t test). Scale bars: A–C, 50 μm; F, 100 μm.
Figure 4.
Figure 4.
Oligodendrocyte number appears normal in the spinal cord of P14 Cnp-Cre Sox2fl/fl mice. A, Low-power confocal images showing the distribution of CC1+ differentiated OLs in the spinal cord. B, Quantification of Olig2+CC1+ differentiated OLs in the spinal cord (n = 4 Cnp-Cre Sox2fl/fl, n = 6 Sox2fl/fl). C, Representative images of Western blotting of MBP, Sox2, and the internal loading control β-actin in the spinal cord. D, qRT-PCR quantification of mRNA levels of Sox2, Mbp, proteolipid protein (Plp), myelin-associated protein (Mag), myelin-associated oligodendrocyte basic protein (Mobp), and Sox10 (n = 4 Cnp-Cre Sox2fl/fl n = 8 Sox2fl/fl). E, Representative confocal images and quantification showing Sox2 is completely deleted in CC1+ OLs in the spinal cord of Cnp-Cre Sox2fl/fl mice (n = 4 Cnp-Cre Sox2fl/fl n = 3 Sox2fl/fl). Arrowheads point to Sox2+CC1+ OLs. **p < 0.01 (two-tailed Student's t test). ***p < 0.001 (two-tailed Student's t test). Spinal cord tissues are harvested at P14 old. Scale bars: A, 500 μm; E, 10 μm.
Figure 5.
Figure 5.
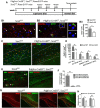
Sox2 is required for OPC population expansion. A, Confocal images depicting Sox2 expression in PDGFRα+ OPCs (left panels, arrowheads) in the corpus callosum of P9 Sox2fl/fl mice (left panels, arrowheads), and Sox2 is abolished in PDGFRα+ OPCs in the corpus callosum of Pdgfrα-Cre:Sox2 cKO mice (right panels, arrowheads). Bottom, Boxed areas represent higher magnification. B, Representative confocal images of Sox10+PDGFRα+ OPCs (arrowheads) in the P14 corpus callosum. Bottom, Boxed areas represent higher magnification. C, Histological quantification of Sox10+PDGFRα+ OPCs and Sox10+ pan-oligodendroglial lineage cells in the subcortical white matter (top, n = 7, Pdgfrα-Sox2 cKO, n = 7 control) and qRT-PCR quantification of Sox2 and Pdgfrα mRNA levels in the P14 forebrains (bottom, n = 4, Pdgfrα-Cre:Sox2 cKO; n = 4, control). D, Immunostaining showing that Sox2 is ablated in PDGFRα+ OPCs in the corpus callosum of P8 Pdgfrα-Cre:Sox2 cKO mice that had received tamoxifen at P1-P3 (right, arrowhead). E, F, Representative images of triple immunostaining of Sox10, PDGFRα, and CC1 (E) and quantification of marker+ cells (F) in the P8 corpus callosum. N = 3 Sox2fl/fl, n = 3 Pdgfrα-Sox2 cKO. G, Significant enriched gene ontology terms from gene ontology analyses using the differentially expressed genes derived from RNA-sequencing (Table 2). RNA was extracted from forebrains of P14 mice that had been treated with tamoxifen at P6 and P7. H, qRT-PCR quantification of P14 forebrain mRNA showing significant decrease of Sox2, and myelination-related genes, Plp-Exon3b (only expressed in myelinating OLs), Mog, Bcas1, Ugt8a, Bmp4, and Qk, which is identified as the antigen recognized by clone CC1 (Bin et al., 2016). N = 6 each group. I, Immunostaining and quantification of CC1 and Sox10 in the subcortical white matter tracts (dotted areas) of P14 forebrain (tamoxifen on P6 ad P7). Hipp, Hippocampus; Ctx, cortex (n = 7 each group). *p < 0.05 (two-tailed Student's t test). **p < 0.01 (two-tailed Student's t test). ***p < 0.001 (two-tailed Student's t test). Scale bars: A, B, D, E, 10 μm; I, 50 μm.
Figure 6.
Figure 6.
Sox2 regulates OPC proliferation but not survival. A, Confocal images of EdU (2 h of pulse labeling before death on P14) and Sox10 double immunostaining. B, Quantification (cell no./mm2) of EdU+Sox10+ and Ki67+Sox10+ proliferative OPCs in the P14 forebrain subcortical white matter. C, Representative confocal images of Sox10 and active caspase 3 double immunostaining in the P14 subcortical white matter (dotted areas). D, Quantification of Caspase3+Sox10+ and TUNEL+Sox10+ oligodendroglial lineage cells in the P14 subcortical white matter. A–D, Animals are P14 old; tamoxifen treatment on P6 and P7. N = 3 in each group. *p < 0.05 (two-tailed Student's t test). ***p < 0.001 (two-tailed Student's t test). E, F, Immunostaining of Sox2 (left panels), and active Caspase3 and Sox10 (right panels) in the neural stem cell niche of hippocampal SGZ of P14 non-Cre control mice (E) and Sox2-Sox2 cKO mice (F) (both received tamoxifen on P6 and P7). Sox2 is completely removed from all Sox2-expressing cells, and active Caspase3+ cells are present and increased in the SGZ neural stem cell niche areas, but not in Sox10+ oligodendroglial lineage cells in the Sox2-Sox2 cKO mice. E, F, Arrows point to representative active Caspase3+ cells. G, Double immunostaining showing that active Caspase3+ apoptotic cells (arrowheads) in the SGZ are GFAP+ radial-like neural stem cells (left), but not doublecortin (DCX)+ neuroblasts, or HuC/D+ neurons in the P14 Sox2-Sox2 cKO mice that had received tamoxifen at P6 and P7. Scale bars: A, 10 μm; C, 20 μm; E, F, 50 μm; G, 10 μm.
Figure 7.
Figure 7.
Oligodendrocyte differentiation and myelination are severely affected in the Sox2 cKO brain at later stages of postnatal development. A, Accelerating Rotarod test showing that Sox10-Sox2 cKO (Sox10-Cre, Sox2fl/fl) mice have severely impaired motor performance function evidenced by significant less retention time on the rotating rod (n = 8 Sox2fl/fl, n = 4 Sox10-Sox2 cKO, P28). B, Double immunostaining of Sox2 and PDGFRα in the corpus callosum of Sox10-Sox2 cKO and control mice. Sox2 is expressed in OPCs of the control mice (arrowheads, left) and absent from OPCs in the Sox10-Sox2 cKO mice (arrowheads, right). C, Grayscale images showing decreased MBP+ myelin fibers in the corpus callosum and overlaying cingular cortex and quantification of MBP and SMI312 densities (n = 4 Sox10-Sox2 cKO, n = 5 Sox2fl/fl). D, Western blotting of Sox2, another SoxB1 family member Sox3, myelin-related genes MBP, CNP, and MAG (left), and quantifications (right). The protein levels of MBP and CNP are reduced by >50% in P21 Sox10-Sox2 cKO brains, compared with non-Cre controls. E, qRT-PCR of forebrain mRNA levels of Sox2, MBP, and myelinating OL-specific Plp-Exon3b (n = 4 Sox10-Sox2 cKO, n = 6 non-Cre controls, P21). F, Immunostaining of mature OL marker CC1 in the P21 corpus callosum. Arrowheads point to representative CC1+ OLs. G, Quantification of PDGFRα+ OPCs and CC1+ OLs in forebrain subcortical white matter tracts (n = 4 Sox10-Sox2 cKO, n = 5 Sox10-Sox2 hetero-cKO, and n = 7 non-Cre controls, P21). H, Low-magnification images showing similar distribution but decreased density of Olig1-expressing oligodendroglial lineage cells in the P21 spinal cord of Sox10-Sox2 cKO (right) compared with Sox2fl/fl control (left). I, Quantification of PDGFRα+ OPCs and CC1+ OLs in the P21 spinal cord (n = 6 Sox2fl/fl, n = 4 Sox10-Sox2 cKO). J, K, Corticospinal tract cross semithin sections of toluidine blue staining (J) and ultrathin sections of transmission electron microscopy (K) from a P28 Sox10-Sox2 mouse and a littermate Sox2fl/fl control. The density of myelinated axons is substantially decreased at low (J) and high (K) magnification images. Two-tailed Student's t test in A, C, D, E, I, one-way ANOCA with Tukey's post hoc test in G: *p < 0.05; **p < 0.01; ***p < 0.001. Scale bars: B, 25 μm; C, 200 μm; F, 50 μm; H, 100 μm; J, 10 μm; K, 1 μm.
Figure 8.
Figure 8.
Sox2 is expressed in adult OPCs and upregulated in TCF7l2-expressing OLs in the spinal cord and brain during remyelination. A, B, Low-magnification confocal images showing Sox2 expression in the corpus callosum of adult mice fed with normal diet (A) and with 6 weeks of 0.25% cuprizone diet followed by 1 week normal diet (6 + 1 weeks) (B). Dotted areas delineate corpus callosum in the mid-sagittal brain sections. C, High-power confocal images showing Sox2 expression in TCF7l2+ newly regenerated OLs at 6 + 1 weeks. D, Triple immunostaining of Sox2, NG2, and TCF7l2 (top) and quantification (bottom) in the corpus callosum of adult mice fed with 6 weeks of cuprizone diet. E–G, Confocal images showing Sox2 expression in TCF7l2+ OLs in the lumbar spinal cord of CFA control (E) and MOG-peptide35-55-induced EAE mice at day 21 after immunization (F) (see Materials and Methods) and the density of Sox2+TCF7l2+ cells (G). E, F, Right, Boxed areas represent higher magnification. H, I, Triple immunostaining of Sox2, NG2, and TCF7l2 (top) and quantification (bottom) in the lumbar spinal cord of adult mice at 21 d (D21) after immunization, and the corrected Sox2 fluorescence density of TCF7l2+ OLs and NG2+ OPCs. *** p < 0.001. Scale bars: A, B, E, F, 50 μm; C, D, H, 10 μm.
Figure 9.
Figure 9.
Sox2 is required for OL regeneration and remyelination in cuprizone-induced demyelinated corpus callosum. A, Transgenic mice (male, 2–3 months old at onset of cuprizone diet) and experimental designs for B1–H. The 0.25% curprizone diet was used in the design. B1, B2, Representative confocal images of Sox2, PDGFRα, and EYFP triple immunostaining in corpus callosum. Arrowheads point to PDGFRα+Sox2+EYFP cells (left) and PDGFRα+Sox2EYFP+ cells (right). B2, Right, Boxed area represents higher-magnification images. B3, Density of Sox2+ cells (cell no./mm2) in corpus callosum (n = 3 each group). C, Double immunostaining of CC1 and Olig2. Dotted areas represent the posterior corpus callosum in mid-sagittal forebrain sections, which is consistently affected in the cuprizone model (Steelman et al., 2012). D, Densities of marker-positive cell as indicated (n = 3 each group). E, Representative confocal images of APC and TCF7l2 double immunostaining. Arrowheads point to APC+TCF7l2+ newly regenerated OLs (Lang et al., 2013; Hammond et al., 2015). F, Quantification of APC+TCF7l2+ cells (n = 3, Sox2 WT + cuprizone; n = 3, Sox2 cKO + cuprizone; n = 4 Sox2 WT + normal diet). G, Confocal images showing MBP and SMI312 in the posterior corpus callosum (coronal forebrain sections). H, Quantification of MBP and SMI312 immunoreactive signals in H (n = 3 each group). B3, D, F, H, *p < 0.05 (two-tailed Student's t test). **p < 0.01 (two-tailed Student's t test). ***p < 0.001 (two-tailed Student's t test). Scale bars: B1, B2, E, 20 μm; C, 50 μm; G, 100 μm.
Figure 10.
Figure 10.
Sox2 regulates OPC proliferation and OL regeneration in the spinal cord in response to inflammatory insults. A, Transgenic mice (female, 2–3 months old) and experimental designs for B1–F. EAE was induced at day 0 by immunizing study mice with MOG peptide35-55 emulsified in CFA (see Materials and Methods) (Guo et al., 2012). Seven days after the last tamoxifen injection, lumbar spinal cord was harvested for analysis. B1–B3, Double immunostaining of Sox2 and NG2 in the lumbar spinal cords of each group. Right, Boxed areas represent higher power. B2, B3, Demyelination lesions with extensive inflammatory infiltrations indicated by dense DAPI nuclear counterstaining. B1, B2, Arrowheads point to Sox2+NG2+ OPCs. NG2+ OPCs in Sox2 cKO have no Sox2 expression (B3) but distribute within the demyelination lesions in a similar pattern to that in Sox2 WT mice (B2). C1–C3, Confocal images of NG2 and Sox10 double immunostaining (C1, C2) and quantification of Sox10+NG2+ OPCs (C3). Arrowheads point to NG2+Sox10+ OPCs. Right, Boxed areas represent higher-magnification images. D1–E, Representative confocal images of Ki67 and Olig2 (D1, D2) and quantifications (E). F, Density of APC+TCF7l2+ newly regenerated OLs. N = 3 in each group. *p < 0.05 (two-tailed Student's t test). **p < 0.01 (two-tailed Student's t test). Scale bars, 20 μm.

Comment in

Similar articles

Cited by

References

    1. Arter J, Wegner M (2015) Transcription factors Sox10 and Sox2 functionally interact with positive transcription elongation factor b in Schwann cells. J Neurochem 132:384–393. 10.1111/jnc.13013 - DOI - PubMed
    1. Bin JM, Harris SN, Kennedy TE (2016) The oligodendrocyte-specific antibody ‘CC1′ binds quaking 7. J Neurochem 139:181–186. 10.1111/jnc.13745 - DOI - PubMed
    1. Cimadamore F, Amador-Arjona A, Chen C, Huang CT, Terskikh AV (2013) SOX2-LIN28/let-7 pathway regulates proliferation and neurogenesis in neural precursors. Proc Natl Acad Sci U S A 110:E3017–E3026. 10.1073/pnas.1220176110 - DOI - PMC - PubMed
    1. Constantinescu CS, Farooqi N, O'Brien K, Gran B (2011) Experimental autoimmune encephalomyelitis (EAE) as a model for multiple sclerosis (MS). Br J Pharmacol 164:1079–1106. 10.1111/j.1476-5381.2011.01302.x - DOI - PMC - PubMed
    1. Dai J, Bercury KK, Ahrendsen JT, Macklin WB (2015) Olig1 function is required for oligodendrocyte differentiation in the mouse brain. J Neurosci 35:4386–4402. 10.1523/JNEUROSCI.4962-14.2015 - DOI - PMC - PubMed

Publication types

MeSH terms

Substances

LinkOut - more resources

  NODES
admin 1
INTERN 2
twitter 2