MiR-205-5p and miR-342-3p cooperate in the repression of the E2F1 transcription factor in the context of anticancer chemotherapy resistance
- PMID: 29464002
- PMCID: PMC5817113
- DOI: 10.7150/thno.19904
MiR-205-5p and miR-342-3p cooperate in the repression of the E2F1 transcription factor in the context of anticancer chemotherapy resistance
Abstract
High rates of lethal outcome in tumour metastasis are associated with the acquisition of invasiveness and chemoresistance. Several clinical studies indicate that E2F1 overexpression across high-grade tumours culminates in unfavourable prognosis and chemoresistance in patients. Thus, fine-tuning the expression of E2F1 could be a promising approach for treating patients showing chemoresistance. Methods: We integrated bioinformatics, structural and kinetic modelling, and experiments to study cooperative regulation of E2F1 by microRNA (miRNA) pairs in the context of anticancer chemotherapy resistance. Results: We showed that an enhanced E2F1 repression efficiency can be achieved in chemoresistant tumour cells through two cooperating miRNAs. Sequence and structural information were used to identify potential miRNA pairs that can form tertiary structures with E2F1 mRNA. We then employed molecular dynamics simulations to show that among the identified triplexes, miR-205-5p and miR-342-3p can form the most stable triplex with E2F1 mRNA. A mathematical model simulating the E2F1 regulation by the cooperative miRNAs predicted enhanced E2F1 repression, a feature that was verified by in vitro experiments. Finally, we integrated this cooperative miRNA regulation into a more comprehensive network to account for E2F1-related chemoresistance in tumour cells. The network model simulations and experimental data indicate the ability of enhanced expression of both miR-205-5p and miR-342-3p to decrease tumour chemoresistance by cooperatively repressing E2F1. Conclusions: Our results suggest that pairs of cooperating miRNAs could be used as potential RNA therapeutics to reduce E2F1-related chemoresistance.
Keywords: Chemotherapy resistance; E2F1; Kinetic modelling.; MicroRNA; Molecular dynamics simulation.
Conflict of interest statement
Competing Interests: The authors have declared that no competing interest exists.
Figures


 and
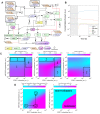
and  in the model). The nominal value of the miRNA transcriptional activation is 1, and values smaller than 1 indicate down-regulation while values greater than 1 represent up-regulation of the miRNA. The four reference points represent normal expression of miRNAs (dot), strong up-regulation of one miRNA (triangles) and moderate up-regulation of both miRNAs (diamond). The numbers denote the gain of E2F1 repression efficiency while increasing miRNA expression levels.


Similar articles
-
Kinetic modeling-based detection of genetic signatures that provide chemoresistance via the E2F1-p73/DNp73-miR-205 network.Cancer Res. 2013 Jun 15;73(12):3511-24. doi: 10.1158/0008-5472.CAN-12-4095. Epub 2013 Feb 27. Cancer Res. 2013. PMID: 23447575
-
GDPD5, a _target of miR-195-5p, is associated with metastasis and chemoresistance in colorectal cancer.Biomed Pharmacother. 2018 May;101:945-952. doi: 10.1016/j.biopha.2018.03.028. Epub 2018 Mar 22. Biomed Pharmacother. 2018. PMID: 29635904
-
MicroRNA-330-5p as a Putative Modulator of Neoadjuvant Chemoradiotherapy Sensitivity in Oesophageal Adenocarcinoma.PLoS One. 2015 Jul 29;10(7):e0134180. doi: 10.1371/journal.pone.0134180. eCollection 2015. PLoS One. 2015. PMID: 26221725 Free PMC article.
-
Regulation of the MIR155 host gene in physiological and pathological processes.Gene. 2013 Dec 10;532(1):1-12. doi: 10.1016/j.gene.2012.12.009. Epub 2012 Dec 14. Gene. 2013. PMID: 23246696 Review.
-
The E2F1-miRNA cancer progression network.Adv Exp Med Biol. 2013;774:135-47. doi: 10.1007/978-94-007-5590-1_8. Adv Exp Med Biol. 2013. PMID: 23377972 Review.
Cited by
-
Identification of miR-29c and its _target FBXO31 as a Key Regulatory Mechanism in Esophageal Cancer Chemoresistance: Functional Validation and Clinical Significance.Theranostics. 2019 Feb 28;9(6):1599-1613. doi: 10.7150/thno.30372. eCollection 2019. Theranostics. 2019. PMID: 31037126 Free PMC article.
-
LncRNA SNHG5 Promotes Proliferation of Glioma by Regulating miR-205-5p/ZEB2 Axis.Onco _targets Ther. 2019 Dec 27;12:11487-11496. doi: 10.2147/OTT.S228439. eCollection 2019. Onco _targets Ther. 2019. PMID: 31920337 Free PMC article.
-
Modelling of Protein Kinase Signaling Pathways in Melanoma and Other Cancers.Cancers (Basel). 2019 Apr 3;11(4):465. doi: 10.3390/cancers11040465. Cancers (Basel). 2019. PMID: 30987166 Free PMC article. Review.
-
The Role of MicroRNAs in Cancer Biology and Therapy from a Systems Biology Perspective.Adv Exp Med Biol. 2022;1385:1-22. doi: 10.1007/978-3-031-08356-3_1. Adv Exp Med Biol. 2022. PMID: 36352209 Review.
-
The miR-532-E2F1 feedback loop contributes to gastric cancer progression.Cell Death Dis. 2022 Apr 19;13(4):376. doi: 10.1038/s41419-022-04832-7. Cell Death Dis. 2022. PMID: 35440106 Free PMC article.
References
Publication types
MeSH terms
Substances
LinkOut - more resources
Full Text Sources
Other Literature Sources

