JAK1/JAK2 inhibition by baricitinib in diabetic kidney disease: results from a Phase 2 randomized controlled clinical trial
- PMID: 29481660
- PMCID: PMC6212720
- DOI: 10.1093/ndt/gfx377
JAK1/JAK2 inhibition by baricitinib in diabetic kidney disease: results from a Phase 2 randomized controlled clinical trial
Abstract
Background: Inflammation signaled by Janus kinases (JAKs) promotes progression of diabetic kidney disease (DKD). Baricitinib is an oral, reversible, selective inhibitor of JAK1 and JAK2. This study tested the efficacy of baricitinib versus placebo on albuminuria in adults with Type 2 diabetes at high risk for progressive DKD.
Methods: In this Phase 2, double-blind, dose-ranging study, participants were randomized 1:1:1:1:1 to receive placebo or baricitinib (0.75 mg daily; 0.75 mg twice daily; 1.5 mg daily; or 4 mg daily), for 24 weeks followed by 4-8 weeks of washout.
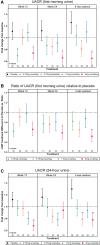
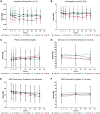
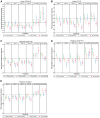
Results: Participants (N = 129) were 63±9.1 (mean±standard deviation) years of age, 27.1% (35/129) women and 11.6% (15/129) African-American race. Baseline hemoglobin A1c (HbA1c) was 7.3±1% and estimated glomerular filtration rate was 45.0±12.1 mL/min/1.73 m2 with first morning urine albumin-creatinine ratio (UACR) of 820 (407-1632) (median; interquartile range) mg/g. Baricitinib, 4 mg daily, decreased morning UACR by 41% at Week 24 compared with placebo (ratio to baseline 0.59, 95% confidence interval 0.38-0.93, P = 0.022). UACR was decreased at Weeks 12 and 24 and after 4-8 weeks of washout. Baricitinib 4 mg decreased inflammatory biomarkers over 24 weeks (urine C-X-C motif chemokine 10 and urine C-C motif ligand 2, plasma soluble tumor necrosis factor receptors 1 and 2, intercellular adhesion molecule 1 and serum amyloid A). The only adverse event rate that differed between groups was anemia at 32.0% (8/25) for baricitinib 4 mg daily versus 3.7% (1/27) for placebo.
Conclusions: Baricitinib decreased albuminuria in participants with Type 2 diabetes and DKD. Further research is required to determine if baricitinib reduces DKD progression.
Figures


Similar articles
-
Baricitinib in patients with inadequate response or intolerance to conventional synthetic DMARDs: results from the RA-BUILD study.Ann Rheum Dis. 2017 Jan;76(1):88-95. doi: 10.1136/annrheumdis-2016-210094. Epub 2016 Sep 29. Ann Rheum Dis. 2017. PMID: 27689735 Free PMC article. Clinical Trial.
-
Baricitinib versus Placebo or Adalimumab in Rheumatoid Arthritis.N Engl J Med. 2017 Feb 16;376(7):652-662. doi: 10.1056/NEJMoa1608345. N Engl J Med. 2017. PMID: 28199814 Clinical Trial.
-
Baricitinib in adult patients with moderate-to-severe atopic dermatitis: A phase 2 parallel, double-blinded, randomized placebo-controlled multiple-dose study.J Am Acad Dermatol. 2019 Apr;80(4):913-921.e9. doi: 10.1016/j.jaad.2018.01.018. Epub 2018 Feb 2. J Am Acad Dermatol. 2019. PMID: 29410014 Clinical Trial.
-
Baricitinib: A Review in Rheumatoid Arthritis.Drugs. 2018 May;78(7):761-772. doi: 10.1007/s40265-018-0908-4. Drugs. 2018. PMID: 29687421 Review.
-
The effect of JAK1/JAK2 inhibition in rheumatoid arthritis: efficacy and safety of baricitinib.Clin Exp Rheumatol. 2019 Jul-Aug;37(4):694-704. Epub 2019 Feb 11. Clin Exp Rheumatol. 2019. PMID: 30767864 Review.
Cited by
-
Molecular Therapeutics for Diabetic Kidney Disease: An Update.Int J Mol Sci. 2024 Sep 19;25(18):10051. doi: 10.3390/ijms251810051. Int J Mol Sci. 2024. PMID: 39337537 Free PMC article. Review.
-
Design and Rationale of the Phase 2 Baricitinib Study in Apolipoprotein L1-Mediated Kidney Disease (JUSTICE).Kidney Int Rep. 2024 Jun 27;9(9):2677-2684. doi: 10.1016/j.ekir.2024.06.033. eCollection 2024 Sep. Kidney Int Rep. 2024. PMID: 39291185 Free PMC article.
-
Pemphigoid diseases in patients with end-stage kidney diseases: pathogenesis and treatment.Front Immunol. 2024 Jul 10;15:1427943. doi: 10.3389/fimmu.2024.1427943. eCollection 2024. Front Immunol. 2024. PMID: 39050843 Free PMC article.
-
Interferons and interferon-related pathways in heart disease.Front Cardiovasc Med. 2024 Apr 11;11:1357343. doi: 10.3389/fcvm.2024.1357343. eCollection 2024. Front Cardiovasc Med. 2024. PMID: 38665231 Free PMC article. Review.
-
Molecular and pathophysiological relationship between obesity and chronic inflammation in the manifestation of metabolic dysfunctions and their inflammation‑mediating treatment options (Review).Mol Med Rep. 2024 Jun;29(6):95. doi: 10.3892/mmr.2024.13219. Epub 2024 Apr 12. Mol Med Rep. 2024. PMID: 38606791 Free PMC article. Review.
References
-
- ANZDATA Registry. 38th Report: Incidence of End Stage Kidney Disease. Adelaide, Australia: Australia and New Zealand Dialysis and Transplant Registry, 2016
Publication types
MeSH terms
Substances
LinkOut - more resources
Full Text Sources
Other Literature Sources
Medical
Research Materials
Miscellaneous

