Cortical activation patterns to spatially presented pure tone stimuli with different intensities measured by functional near-infrared spectroscopy
- PMID: 29516587
- PMCID: PMC6866446
- DOI: 10.1002/hbm.24034
Cortical activation patterns to spatially presented pure tone stimuli with different intensities measured by functional near-infrared spectroscopy
Abstract
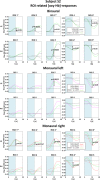
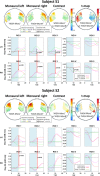
Functional near-infrared spectroscopy (fNIRS) is an emerging technique for the assessment of functional activity of the cerebral cortex. Recently fNIRS was also envisaged as a novel neuroimaging approach for measuring the auditory cortex activity in the field of in auditory diagnostics. This study aimed to investigate differences in brain activity related to spatially presented sounds with different intensities in 10 subjects by means of functional near-infrared spectroscopy (fNIRS). We found pronounced cortical activation patterns in the temporal and frontal regions of both hemispheres. In contrast to these activation patterns, we found deactivation patterns in central and parietal regions of both hemispheres. Furthermore our results showed an influence of spatial presentation and intensity of the presented sounds on brain activity in related regions of interest. These findings are in line with previous fMRI studies which also reported systematic changes of activation in temporal and frontal areas with increasing sound intensity. Although clear evidence for contralaterality effects and hemispheric asymmetries were absent in the group data, these effects were partially visible on the single subject level. Concluding, fNIRS is sensitive enough to capture differences in brain responses during the spatial presentation of sounds with different intensities in several cortical regions. Our results may serve as a valuable contribution for further basic research and the future use of fNIRS in the area of central auditory diagnostics.
Keywords: auditory cortex; auditory diagnostics; functional near-infrared spectroscopy; laterality effects; neuroimaging; spatial sound presentation.
© 2018 Wiley Periodicals, Inc.
Conflict of interest statement
All authors declare that they have no conflict of interests.
Figures


Similar articles
-
Neuroimaging to detect cortical projection of vestibular response to caloric stimulation in young and older adults using functional near-infrared spectroscopy (fNIRS).Neuroimage. 2013 Aug 1;76:1-10. doi: 10.1016/j.neuroimage.2013.02.061. Epub 2013 Mar 22. Neuroimage. 2013. PMID: 23523804 Free PMC article.
-
Functional near infra-red spectroscopy (fNIRS) in schizophrenia: A review.Asian J Psychiatr. 2017 Jun;27:18-31. doi: 10.1016/j.ajp.2017.02.009. Epub 2017 Feb 16. Asian J Psychiatr. 2017. PMID: 28558892 Review.
-
A semi-immersive virtual reality incremental swing balance task activates prefrontal cortex: a functional near-infrared spectroscopy study.Neuroimage. 2014 Jan 15;85 Pt 1:451-60. doi: 10.1016/j.neuroimage.2013.05.031. Epub 2013 May 17. Neuroimage. 2014. PMID: 23684867
-
Validating the use of functional Near-Infrared Spectroscopy in monkeys: The case of brain activation lateralization in Papio anubis.Behav Brain Res. 2021 Apr 9;403:113133. doi: 10.1016/j.bbr.2021.113133. Epub 2021 Jan 19. Behav Brain Res. 2021. PMID: 33482169
-
A brain of two halves: insights into interhemispheric organization provided by near-infrared spectroscopy.Neuroimage. 2014 Jan 15;85 Pt 1:354-62. doi: 10.1016/j.neuroimage.2013.06.023. Epub 2013 Jun 14. Neuroimage. 2014. PMID: 23770412 Review.
Cited by
-
Predicting poststroke dyskinesia with resting-state functional connectivity in the motor network.Neurophotonics. 2023 Apr;10(2):025001. doi: 10.1117/1.NPh.10.2.025001. Epub 2023 Apr 4. Neurophotonics. 2023. PMID: 37025568 Free PMC article.
-
Head hemodynamics and systemic responses during auditory stimulation.Physiol Rep. 2022 Jul;10(13):e15372. doi: 10.14814/phy2.15372. Physiol Rep. 2022. PMID: 35785451 Free PMC article.
-
Hemodynamic responses to emotional speech in two-month-old infants imaged using diffuse optical tomography.Sci Rep. 2019 Mar 18;9(1):4745. doi: 10.1038/s41598-019-39993-7. Sci Rep. 2019. PMID: 30894569 Free PMC article.
-
Exploring the neural correlates of self-related names in healthy subjects.Medicine (Baltimore). 2020 Dec 18;99(51):e23658. doi: 10.1097/MD.0000000000023658. Medicine (Baltimore). 2020. PMID: 33371101 Free PMC article.
-
Cerebral Representation of Sound Localization Using Functional Near-Infrared Spectroscopy.Front Neurosci. 2021 Dec 14;15:739706. doi: 10.3389/fnins.2021.739706. eCollection 2021. Front Neurosci. 2021. PMID: 34970110 Free PMC article.
References
-
- Bauernfeind, G. (2012). Using functional near‐infrared spectroscopy (fNIRS) for optical brain‐computer interface (oBCI) applications. Ph.D. thesis. Graz University of Technology, Graz, Austria.
-
- Bauernfeind, G. , Haumann, S. , & Lenarz, T. (2016). fNIRS for future use in auditory diagnostics. Current Directions in Biomedical Engineering, 2, 229–232. 10.1515/cdbme-2016-0051 - DOI
-
- Bauernfeind, G. , Wriessnegger, S. C. , Daly, I. , & Müller‐Putz, G. R. (2014). Separating heart and brain: On the reduction of physiological noise from multichannel functional near‐infrared spectroscopy (fNIRS) signals. Journal of Neural Engineering, 11(5), 056010 10.1088/1741-2560/11/5/056010. - DOI - PubMed
Publication types
MeSH terms
LinkOut - more resources
Full Text Sources
Other Literature Sources

