. 2018 Apr;556(7700):249-254.
doi: 10.1038/s41586-018-0018-1. Epub 2018 Apr 3.

Metabolic enzyme PFKFB4 activates transcriptional coactivator SRC-3 to drive breast cancer

Affiliations

Metabolic enzyme PFKFB4 activates transcriptional coactivator SRC-3 to drive breast cancer

Subhamoy Dasgupta et al. Nature. 2018 Apr.

Abstract

Alterations in both cell metabolism and transcriptional programs are hallmarks of cancer that sustain rapid proliferation and metastasis 1 . However, the mechanisms that control the interaction between metabolic reprogramming and transcriptional regulation remain unclear. Here we show that the metabolic enzyme 6-phosphofructo-2-kinase/fructose-2,6-bisphosphatase 4 (PFKFB4) regulates transcriptional reprogramming by activating the oncogenic steroid receptor coactivator-3 (SRC-3). We used a kinome-wide RNA interference-based screening method to identify potential kinases that modulate the intrinsic SRC-3 transcriptional response. PFKFB4, a regulatory enzyme that synthesizes a potent stimulator of glycolysis 2 , is found to be a robust stimulator of SRC-3 that coregulates oestrogen receptor. PFKFB4 phosphorylates SRC-3 at serine 857 and enhances its transcriptional activity, whereas either suppression of PFKFB4 or ectopic expression of a phosphorylation-deficient Ser857Ala mutant SRC-3 abolishes the SRC-3-mediated transcriptional output. Functionally, PFKFB4-driven SRC-3 activation drives glucose flux towards the pentose phosphate pathway and enables purine synthesis by transcriptionally upregulating the expression of the enzyme transketolase. In addition, the two enzymes adenosine monophosphate deaminase-1 (AMPD1) and xanthine dehydrogenase (XDH), which are involved in purine metabolism, were identified as SRC-3 _targets that may or may not be directly involved in purine synthesis. Mechanistically, phosphorylation of SRC-3 at Ser857 increases its interaction with the transcription factor ATF4 by stabilizing the recruitment of SRC-3 and ATF4 to _target gene promoters. Ablation of SRC-3 or PFKFB4 suppresses breast tumour growth in mice and prevents metastasis to the lung from an orthotopic setting, as does Ser857Ala-mutant SRC-3. PFKFB4 and phosphorylated SRC-3 levels are increased and correlate in oestrogen receptor-positive tumours, whereas, in patients with the basal subtype, PFKFB4 and SRC-3 drive a common protein signature that correlates with the poor survival of patients with breast cancer. These findings suggest that the Warburg pathway enzyme PFKFB4 acts as a molecular fulcrum that couples sugar metabolism to transcriptional activation by stimulating SRC-3 to promote aggressive metastatic tumours.


Figures
Extended Data Figure 1
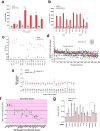
Extended Data Figure 1. Kinome-wide screen identified potential kinases regulating SRC-3 intrinsic transcriptional activity
a, HeLa cells expressing varying concentrations of pBIND or pBIND-SRC-3 construct were used to measure SRC-3 activity. [Mean ± s.d., n=4 biologically independent samples, *P<0.000001 One-way ANOVA with Sidak’s multiple comparison test]. Normalized RLU, relative luciferase units normalized by protein content b, HeLa cells expressing pBIND or pBIND-SRC-3 were treated with siRNA _targeting GFP or PRKCZ at the indicated dose followed by luciferase assay to measure SRC-3 activity. [Mean ± s.d., n=3 biologically independent samples; *P<0.000001 One-way ANOVA with Tukey’s multiple comparison test]. c, Different control siRNAs _targeting GFP or luciferase (Luc) were used to measure SRC-3 activity in HeLa cells expressing pBIND or pBIND-SRC-3. [Mean (Center) ± s.d. (error), n=3 biologically independent samples,]. The GFP-siRNA controls in red box were used in the library screen as controls. d, Effect on SRC-3 transcriptional activity by three sets of siRNA (Set A, B and C) _targeting 636 human kinases in HeLa cells. Effect of control siRNA-GFP was set at one (dotted line), cut off fold for increased activation set at 2 and reduced activity at 0.75 following z-score analysis. [n=3, siRNAs/kinase n=6, siGFP/plate; total n=1908 (siRNAs _targeting kinases) n=144 (siRNA-GFP control) independent samples]. e, SRC-3 activity in HeLa cells across 26 kinome-library plates in presence of control siRNA _targeting GFP. [Mean (center) ± s.d. (error), n=6 biologically independent replicates for each 24 plates]. f, A secondary screen was performed in HeLa cells to confirm the primary screen hits using a pooled siRNA _targeting the kinases followed by SRC-3 transcriptional activity. [n=3 biologically independent samples; Boxes represent 25th to 75th percentile, line in the middle represents median, whiskers showing min to max all points]. g, Relative proliferation of MDA-MB-231 cells four days after treatment with siRNAs _targeting GFP (control), SRC-3 or indicated kinases. [Mean ± s.d., n=3 biological replicates, Two-way ANOVA with Dunnett's multiple comparisons test. *P<0.0001.]
Extended Data Figure 2
Extended Data Figure 2. PFKFB4, the top hit from the kinase screen, enhances the transcriptional activity of SRC-3
a, Effect of PFKFB4 knockdown on SRC-3 transcriptional activity in various breast cancer cell lines. [Mean ± s.d., n=3 or n=4 (siGFP + pBIND-SRC-3), biologically independent cells; *P<0.000009 Two-way ANOVA with Tukey’s multiple comparison test]. b, SRC-3 transcriptional activity in MDA-MB-231 cells expressing shRNAs _targeting PFKFB4 (sh09 and sh20) or control (non-_targeting- NT) co-transfected with pBIND or pBIND-SRC-3. [Mean ± s.d., n=5, biological replicates, one-way one-way analysis of variance (ANOVA) with Tukey’s Multiple comparisons test]. c, Protein expression of PFKFB4 or actin in MDA-MB-231 cells expressing shRNAs _targeting PFKFB4. d, Expression of PFKFB4 and SRC-3 mRNA in indicated breast tumor cells after treatment with siRNAs _targeting GFP (control), or PFKFB4. [Mean ± s.d., n=4 or n=3, biological replicates (siPFKFB4 to measure PFKFB4 gene expression); For exact P-values please refer to source data. e, Expression of PFKFB4 and SRC-3 mRNA in MDA-MB-231 cells transduced with AdGFP, or AdPFKFB4. [Mean ± s.d., n=6; biologically independent cells P<0.000001 Two-way ANOVA with Tukey’s multiple comparison test]. f, MDA-MB-231 cells (left panel) were stained with specific antibodies SRC-3 (rabbit) and PFKFB4 (mouse) prior to proximity ligation assay (PLA). The PLA signals between endogenous SRC-3 and PFKFB4 are shown in the red channel, DAPI was used to stain the nuclei (blue) and merge showing overlay of red and blue channels. Two representative fields from biologically independent experiments were shown from n=5. Right panel- control cells were stained with either SRC-3, PFKFB4 or secondary antibody-conjugated with probes. Scale bar = 20µM (left) and 40µM (right). Data shown are representative of 3 biologically independent experiments with similar results.
Extended Data Figure 3
Extended Data Figure 3. PFKFB4 functions as a protein kinase by phosphorylating SRC-3 at the S857 residue
a, In vitro PFKFB4 kinase assay in presence of purified SRC-3 protein, fructose-6-phosphate (F6P), ATP and increasing concentration of recombinant PFKFB4 enzyme followed by SDS-PAGE. Immunoblotting with p-Ser/Thr antibody shows the level of phosphorylated Ser/Thr-SRC-3 protein. b, In vitro PFKFB4 kinase assay in presence of purified SRC-3 protein, PFKFB4 enzyme and varying concentrations of F6P and ATP followed by SDS-PAGE. Immunoblotting with p-Ser/Thr antibody shows the level of p-SRC-3 protein. c, Coomassie blue stain showing the levels of GST-fused SRC-3 fragments used in in vitro kinase reactions performed in Fig. 2b. d, Proteomics analysis of in vitro kinase assay using the GST-SRC-3-CID fragment in the presence of PFKFB4 enzyme and ATP followed by mass spectrometric analyses. Mass spectrum shows the green phosphorylation peak. e, Proteomics analysis of an in vitro kinase assay using a S857A-mutated GST-SRC-3-CID protein in the presence of PFKFB4 enzyme and ATP, followed by mass spectrometric analyses. Mass spectrum failed to detect phosphorylation peaks in the S857A mutated SRC-3-CID protein. f, Expression of PFKFB1, PFKFB2, PFKFB3 and PFKFB4 in MDA-MB-231 cells expressing shRNAs _targeting PFKFB4 (sh#09 and sh#20). mRNA levels were normalized to internal housekeeping gene actin. [Mean ± s.d., n=3, biological replicates, two-way ANOVA with Tukey’s Multiple comparisons test, *P<0.05]. g, Protein levels of pSRC-3-S857, total-SRC-3 and actin in MDA-MB-231 cells stably expressing NTshRNA, SRC-3shRNA, or expression of shRNA-resistant S857A (shSRC-3+S857A) mutant or wild-type SRC-3 in SRC-3 depleted cells (shSRC-3+WT-SRC-3) cultured in 25mM glucose. Protein bands were quantified by Image J after normalization to β-actin. h, MDA-MB-231 cells stably expressing NT-shRNA or shRNA _targeting PFKFB4 were grown in presence of 25mM glucose or were glucose starved for 4 hours followed by incubation with Streptolysin O (SLO) for 5 min. FBP (10µM) was added to glucose starved cells for additional 1 hour, followed by cell lysis and immunoblotting. Protein bands were quantified by Image J after normalization to β-actin and the NT shRNA lane was set to 1. i, Relative luciferase activity (RLU) showing the transcriptional activity of SRC-3 in MDA-MB-231 cells transduced with Adv. GFP or Adv. PFKFB4 cultured in presence of 5mM, 15mM or 25mM glucose. [Mean ± s.d., n=6 (pBIND) and n=3 (pBIND-SRC-3) biological cell samples, two-way ANOVA with Tukey’s Multiple comparisons test, *P<0.000001]. Data shown in 3a-c and 3f-h are representative of 3 biologically independent experiments with similar results, and 3d-e are representative of 2 biologically independent experiments each run with three different reactions all showing similar results and peptide coverage.
Extended Data Figure 4
Extended Data Figure 4. Ser-857 phosphorylation enhances SRC-3 transcriptional activity
a, Relative luciferase activity (RLU) showing the activity of SRC-3WT, SRC-3S857A and SRC-3S857E in MDA-MB-231 cells transduced with lentivirus expressing NTshRNA or shPFKFB4 cultured in presence of 5mM or 25mM glucose. [Mean ± s.d., n=3 biological cell samples, two-way ANOVA with Tukey’s Multiple comparisons test, *P<0.000001]. b, Relative luciferase activity (RLU) showing the activity of SRC-3 in MDA-MB-231 cells stably expressing lentivirus shPFKFB4 and cultured in presence of 25mM glucose. The cells are then co-transfected with empty vector, WT-PFKFB4, and PFKFB4-mutants G46A, P48A, G51A, 230A and 238A. [Mean ± s.d., n=6 biological cell samples, two-way ANOVA with Tukey’s Multiple comparisons test, *P<0.000001]. c, MDA-MB-231 cells stably expressing shRNAs _targeting PFKFB4 (231-sh-PFKFB4) were transfected with constructs expressing empty vector (vector), WT-PFKFB4, and PFKFB4-mutants G46A, P48A, G51A, 230A and 238A and cultured in presence of 25mM glucose. Protein levels of phospho-SRC-3 (S857), PFKFB4 and β-actin were detected by immunoblotting. d, Relative luciferase activity (RLU) showing the activity of estrogen receptor-α (ERα) in MCF7-Mar-luc cells transduced with lentivirus expressing NTshRNA or shSRC-3 cultured in presence of 5mM or 25mM glucose stimulated with ethanol (−E2) or with 100nm (E2). [Mean ± s.d., n=3 biological cell samples, two-way ANOVA with Tukey’s Multiple comparisons test, *P<0.000001]. e, Relative luciferase activity (RLU) showing the activity of estrogen receptor-α (ERα) in MCF7-Mar-luc cells transduced with adenovirus expressing Adv. GFP or Adv. PFKFB4. Cells transduced with Adv. PFKFB4 were infected to express NTshRNA or shSRC-3 after 2 days and then cultured in presence of 5mM or 25mM glucose stimulated with ethanol (−E2) or with 100nm (E2). [Mean ± s.d., n=3 biological cell samples, two-way ANOVA with Tukey’s Multiple comparisons test, *P<0.000001]. f, Survival assay in MCF7 cells showing the effect of NT-shRNA, shSRC-3, and re-expression of WT-SRC-3 or SRC-3S857A in SRC-3 depleted cells cultured in charcoal-stripped media supplemented with 25mM glucose and E2 for 7 days [n=3 biological independent data are shown]. All data shown are representative of 3 independent experiments with similar results.
Extended Data Figure 5
Extended Data Figure 5. Increased glucose and purines are required for SRC-3 dependent growth
a, Real time measurement of MCF10A cell proliferation transduced with adenovirus Adv. GFP or Adv. SRC-3 in presence of 93 different metabolites. n=3 independent plates run for each sample. Mean (center) ± s.d. (error bars), b, Relative growth of MCF10A cells transduced with Adv. GFP or Adv. SRC-3 in presence of D-glucose, c, adenosine and d, inosine. Mean ± s.d., n=6 biological cell samples, Unpaired t-test two tailed. [Boxes represent 25th to 75th percentile, line in the middle represents median, whiskers showing min to max all points]. e–f, Relative levels of intermediary metabolites in MDA-MB-231 cells after treatment with shRNAs _targeting PFKFB4 or SRC-3 compared to control shRNA (NT). e, Glycolytic and pentose phosphate pathway (PPP) metabolites. f, Nucleotides. [Mean ± s.d., n=3 biological independent samples, two-way ANOVA with Tukey’s Multiple comparisons test, *P<0.05]. g, Total levels of purines in MCF10A cells transduced with Adv. GFP and Adv. SRC-3. [Mean ± s.d., n=3 biological independent samples, two-way ANOVA with Tukey’s Multiple comparisons test,; Boxes represent 25th to 75th percentile, line in the middle represents median, whiskers showing min to max all points]. For exact P-values please refer to source data.
Extended Data Figure 6
Extended Data Figure 6. SRC-3 drives the purine synthesis program under conditions of active glycolysis
a, MDA-MB231 cells stably expressing NTshRNA, shPFKFB4 and shSRC-3 were fed with [6-C13glucose]. Ribulose/Xylulose-5P (m+1) labeling from [6-C13glucose] were shown. [Mean ± s.d., n=3 biological cell samples, One-way ANOVA with Tukey’s Multiple comparisons test, ***P=0.00013; ****P=0.000078]. b, Genes involved in oxidative and non-oxidative PPP. [Mean ± s.d., n=3 biological cell samples, Two-way ANOVA with Sidak's multiple comparisons test, *P=0.0431]. c, Genes involved in nucleotide synthesis. [Mean ± s.d., n=3 biological cell samples, Two-way ANOVA with Sidak's multiple comparisons test]. d, Expression of metabolic enzymes transketolase (TKT), xanthine dehydrogenase (XDH), and adenosine monophosphate dehydrogenase 1 (AMPD1) in MDA-MB-231 cells transduced with adenovirus expressing GFP (control) and PFKFB4 cultured in presence of 5mM, 15mM or 25mM glucose. [Mean ± s.d., n=3 biological cell samples, two-way ANOVA with Dunnett's multiple comparisons test]. e–f, MDA-MB231 cells stably expressing NTshRNA, shPFKFB4 and shSRC-3 were fed with [6-C13glucose]. e, Seduheptulose-7P (m+1). and f, Erythrose-4P labeling from [6-C13glucose] were shown. [Mean ± s.d., n=3 biological cell samples, two-way ANOVA with Dunnett's multiple comparisons test (e) or with Tukey’s multiple comparison test (f), Boxes represent 25th to 75th percentile, line in the middle represents median, whiskers showing min to max all points]. For exact P-values please refer to source data.
Extended Data Figure 7
Extended Data Figure 7. Growth defect due to loss of SRC-3 or PFKFB4 is rescued by exogenous purines
a, Expression of metabolic enzymes transketolase (TKT), xanthine dehydrogenase (XDH), adenosine monophosphate dehydrogenase 1 (AMPD1) and SRC-3 in MDA-MB-231 cells expressing shRNA _targeting control-shNT, shSRC-3-21 or re-expression of shRNA –resistant wildtype SRC-3 protein in SRC-3 depleted cells (shSRC-3-21+WT-SRC-3). [Mean ± s.d., n=4 biological cell samples, two-way ANOVA with Tukey’s Multiple comparisons test]. b, Relative proliferation of MDA-MB-231 expressing shRNA _targeting SRC-3 (shSRC-3-1 and shSRC-3-2) or NT after treatment with siRNAs _targeting luciferase (siLuc) as control or PFKFB4 under conditions indicated. [Mean ± s.d., n=6 samples from biologically independent experiments, two-way ANOVA with Tukey’s Multiple comparisons test, ****P<0.000001]. c, MDA-MB231 cells stably expressing NTshRNA, shPFKFB4 and shSRC-3 were fed with [U-C13glucose] for 48 hours. Adenosine C13 labeling from [U-C13glucose] were shown. [Mean ± s.d., n=3 samples from biologically independent experiments, one-way ANOVA with Tukey’s Multiple comparisons test; Boxes represent 25th to 75th percentile, line in the middle represents median, whiskers showing min to max all points]. Data shown are representative of 3 biologically independent experiments with similar results. For exact P-values please refer to source data.
Extended Data Figure 8
Extended Data Figure 8. PFKFB4-SRC-3 stabilizes ATF4 transcription factor to promote purine synthesis
a, Chromatin localization peaks of SRC-3 and ATF4 on TKT, XDH and AMPD1 genes in mouse liver. b, ATF4 binding peaks are conserved on three SRC-3 _target purine biosynthetic genes in both mouse and human genomes. c, Chromatin immunoprecipitation (ChIP) of ATF4, total SRC-3, and pSRC-3-S857 from MDA-MB-231 cells treated with 5 mM or 25 mM glucose compared to an IgG isotype control. qPCR was performed to determine amount of promoter enrichment. d, ChIP-qPCR was performed from MDA-MB-231 cells cultured in 25 mM glucose expressing shSRC-3, shPFKFB4, or control-shNT [Mean ± s.d., n=3 biological cell samples; one-way ANOVA with Tukey's multiple comparisons test compared to 5 mM glucose groups (3e, f, g); and compared to shNT group (3h)]. e, ChIP of ATF4, total SRC-3 (BD Biosciences-Ab), and pSRC-3-S857 from MDA-MB-231 cells on AMPD1 promoter treated with non-_targeting siRNA (NTsiRNA) or siRNA against ATF4 and cultured in presence of 25 mM glucose compared to an IgG isotype control. qPCR was performed to determine amount of promoter enrichment. [Mean ± s.d., n=3 biological cell samples; one-way ANOVA with Tukey’s Multiple comparisons]. f, Expression of metabolic enzymes transketolase (TKT), xanthine dehydrogenase (XDH), adenosine monophosphate dehydrogenase 1 (AMPD1) and SRC-3 in MDA-MB-231 cells expressing siRNA _targeting control (NT), or siRNA-ATF4. [Mean ± s.d., n=3 biological cell samples, two-way ANOVA with Sidak’s Multiple comparisons test]. For exact P-values please refer to source data.
Extended Data Figure 9
Extended Data Figure 9. PFKFB4-SRC-3 axis promotes breast tumor growth and metastasis
a, Primary tumors resected out after six weeks. b, Ki-67 staining of primary tumors from animals injected with MDA-MB-231 cells stably expressing NT-shRNA, shSRC-3 or shPFKFB4. Data shown representative of five fields per slide from n=5 animals per group with similar findings. c, Quantification of Ki67 positive cells in the tumor. [Mean ± s.d., n=5 animals per group, average of five fields counted from each slide, one-way ANOVA with Dunnett's multiple comparisons test, ****P=0.0001] d, Primary tumor growth in animals injected with MDA-MB-231 cells stably expressing shRNA _targeting SRC-3 (shSRC-3), PFKFB4 (shPFKFB4), or expression of wildtype SRC-3 (WT-SRC-3) or S857A mutant in the shSRC-3 knockdown cells. [Mean ± s.d., n=5 animals per group, two-way ANOVA with Tukey’s multiple comparisons test, *P<0.000001]. e, Immunoblot showing the relative expression of SRC-3 in primary tumors from MDA-MB-231 cells stably expressing NTshRNA, shSRC-3, or re-expression of WT-SRC-3 or S857A mutant in the shSRC-3 knockdown cells. n=5 animals per group was pooled to generate the tumor lysate used for analysis. Semiquantitative levels of each band were analyzed by densitometry using UVP Vision Works LS software, and the relative values normalized to actin are indicated numerically under each lane. f, Graph representing the photon flux of animals from different groups. Animals (n=5) in SRC-3-WT, S857A and shPFKFB4; and (n=4) for shSRC-3. One-way ANOVA with Dunnett's multiple comparisons test. *P<0.0001 [Line shows median with range]. g, mRNA expression of three metabolic enzymes (TKT, XDH, and AMPD1), SRC-3 and PFKFB4 from the primary tumors. [Mean ± s.d., n=5 animals per group, two-way ANOVA with Tukey’s multiple comparisons test]. h, Expression of PFKFB4 in breast cancer patients across different subtypes compared to normal breast tissue. Normal Basal = 17; Basal = 139; Normal_Her2 = 9; Her2 = 67; Normal Luminal A= 62; Luminal A = 418; Normal Luminal B = 21 and LumB = 186. [Line in the center of the rectangle represent median, top edge of the rectangle represent 3rd quartile, bottom edge of the rectangle represent 1st quartile, top whisker represent maximum, and bottom whisker represent minimum.] All Data shown are representative of 3 biologically independent experiments with similar results. For exact P-values please refer to source data.
Extended Data Figure 10
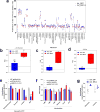
Extended Data Figure 10. The PFKFB4-SRC-3 axis drives transcriptional programming in breast cancer patients
a, b, Expression of p-SRC-3, SRC-3 and PFKFB4 in ER(+) breast tumor specimens and matched adjoining normal tissues as detected by immunoblotting n=14, ER-positive breast cancer patients. c, Semi-quantitative levels of each band shown in a and b, were analyzed by densitometry using UVP Vision Works LS software, and the relative values normalized to actin were used to calculate the fold change (tumor/normal) and plotted to obtain the correlation between PFKFB4 and pSRC-3-Ser857 expression [n=14 normal and tumor tissues, R=0.63, p=0.02 Spearman's rank correlation coefficient]. d, Log fold change in protein expression of the PFKFB4-SRC-3 signature compared to the control knockdown (NTshRNA) as determined using a parametric t-test as implemented in the python (spicy) statistical system. Significance was assessed for P<0.05, fold change exceeding 1.25x, are only considered as true regulators [Mean ± s.d., n=3 biologically independent samples]. e, Kaplan–Meier survival plot showing poor survival of breast cancer patients with basal subtype (triple negative) disease exhibiting an increased expression of a common proteomic signature induced by PFKFB4 and SRC-3 axis. The cohort of patients was collected by the The Cancer Genome Atlas (TCGA; P=0.0365, log-rank test; P=0.02971, Cox proportional hazards; two-sided). f, Cartoon model describing the crosstalk between glycolysis and purine generation highlighting the essential steps regulated by pSRC-3-S857. This PFKFB4-dependent SRC-3 phosphorylation enhances mRNA expression of genes involved in purine metabolism driving breast tumor growth, proliferation and metastasis. F6P, fructose-6-phosphate; F1,6-P, fructose 1,6 bisphosphate; AICAR, 5-Aminoimidazole-4-carboxamide ribonucleotide; IMP, Inosine monophosphate; AMP, Adenosine monophosphate. g, Model showing that in glycolytic breast tumors activated PFKFB4 drives SRC-3 phosphorylation at Ser857, which then activates ER-positive primary tumor growth in conjunction with E2-liganded ER, as well in ER-negative/recurrent tumors in conjunction with ATF4, driving aggressive metastatic disease.
Figure 1
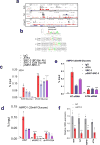
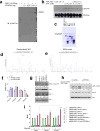
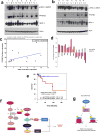
Figure 1. PFKFB4 is an essential activator of transcriptional coregulator SRC-3
a, Schematics showing the RNAi kinome library screening with SRC-3 transcriptional activity assay using GAL4 DNA binding site-luciferase reporter (pG5-luc) along with GAL4-DNA binding domain (DBD)-full-length SRC-3 fusion (pBIND-SRC-3) or control pBIND as readout. b, Log2 fold change in SRC-3 activity with three siRNAs/kinase represented as Set A, Set B and Set C in the 3D plot (n=3, biologically independent samples _targeted by siRNAs). Suppression of kinases increasing SRC-3 activity with 2/3 siRNAs (red) or 3/3 siRNAs (purple), and reducing SRC-3 activity with 3/3 siRNAs (green) or 2/3 (blue). c, Kinases scoring reproducibly in modulating SRC-3 activity. d, SRC-3 activity in MCF-7 cells transduced with adv. GFP or PFKFB4 and co-transfected with pBIND (n=3) or pBIND-SRC-3 (n=4). [Mean ± s.d., one-way ANOVA with Tukey’s Multiple comparisons test]. g, Protein expression of SRC-3, PFKFB4 and actin in MCF-7 cells overexpressing PFKFB4 or control-GFP. For exact P-values please refer to source data, and n represents biologically independent samples.
Figure 2
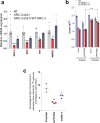
Figure 2. PFKFB4 phosphorylates SRC-3 by functioning as a protein kinase
a, Upper panel-Recombinant GST-fused PFKFB4 incubated with full-length SRC-3 (SRC-3 FL) in presence of [32P]ATP in an in vitro kinase assay. Lower panels- SRC-3 and PFKFB4 protein levels were analyzed by immunoblotting. b, In vitro kinase assay of PFKFB4 in the presence of SRC-3 fragments expressing different domains or full length SRC-3-FL. c, HEK293T cells expressing Flag-tagged-SRC-3 and PFKFB4 cultured in different concentrations of glucose and immunoprecipitated by Flag or p-Ser/Thr antibodies followed by immunoblotting. d, MDA-MB-231 cells stably expressing shRNAs _targeting PFKFB4 (sh-PFK#09 and sh-PFK#20) or control NT-shRNA grown in presence of 5mM, 25mM glucose or glucose withdrawn from cells grown in 25mM of glucose and replaced with 5mM (WD) for 6 hours. Protein levels of pSRC-3-S857, PFKFB4 and β-actin were detected by immunoblotting. e, HEK293T cells expressing pBIND, pBIND-SRC-3 or pBIND-SRC-3-S857A were transduced with Adv. GFP or PFKFB4, and cultured in 5mM or 25mM glucose followed by luciferase assay. [Boxes represent 25th to 75th percentile, line in the middle represents median, whiskers showing min to max all points, + indicates mean, n=6 biologically independent experiments; Two-way ANOVA with Tukey’s Multiple comparisons test]. Data shown in (a–e) are representative of 3 biologically independent experiments with similar results. For exact P-values please refer to source data.
Figure 3
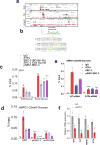
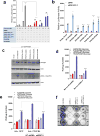
Figure 3. SRC-3 phosphorylation by PFKFB4 enhances gene expression of metabolic enzymes
a, Relative levels of metabolites altered by sh-PFKFB4 or sh-SRC-3 compared to control shNT in MDA-MB231 cells. [Mean ± s.d., n=3 biologically independent samples; two-way ANOVA with Tukey’s Multiple comparisons test] b, Relative proliferation of MDA-MB-231 and MCF-7 cells four days after treatment with siRNA-GFP (control) or SRC-3 under conditions indicated. [Mean ± s.d., n=5 biologically independent replicates; one-way ANOVA with Tukey’s Multiple comparisons test]. c, Expression of metabolic enzymes TKT, XDH, and AMPD1 in MDA-MB-231 cells after treatment with siRNAs-GFP (control), PFKFB4, or SRC-3. [Mean ± s.d., n=3 biologically independent samples; one-way ANOVA with Tukey’s Multiple comparisons test]. d, Immunoprecipitation of ATF4 from MDA-MB-231 cells grown in 5mM or 25mM glucose expressing shPFKFB4, shSRC-3, control- NTshRNA or expression of SRC-3-S857A in shSRC-3 cells. Levels of pSRC-3-S857 associated with ATF4 were detected by immunoblotting. IgG light chain-HRP was used to probe ATF4 in immunoblotting. e–g, Chromatin immunoprecipitation (ChIP) of ATF4, total SRC-3, and pSRC-3-S857 followed by qPCR from MDA-MB-231 cells treated with 5 mM or 25 mM glucose compared to an IgG isotype control. e, TKT. f, AMPD1. [Mean ± s.d., n=3 biologically independent samples used for ChIP; one-way ANOVA with Tukey's multiple comparisons test compared to 5 mM glucose groups]. For exact P-values please refer to source data.
Figure 4
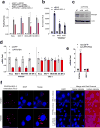
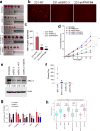
Figure 4. Activation of the PFKFB4-SRC-3 axis drives breast tumor primary growth and metastasis
a–g, MDA-MB-231 cells stably expressing shSRC-3, shPFKFB4, or wildtype SRC-3 (WT-SRC-3) or the SRC-3 S857A mutant in the shSRC-3 cells were injected into nude female mice. a, Schematics of the in vivo orthotopic xenograft experiment. Tumor cells were injected in the mammary fat pad (n=5 mice) and after six weeks primary tumors were resected out and animals were monitored by bioluminescence. b, Tumor volume. One-way ANOVA with Tukey’s Multiple comparisons test. n=5 [Boxes represent 25th to 75th percentile, line in the middle represents median, whiskers showing min to max all points, + indicates mean.] c, Bioluminescence imaging of animals four weeks post-surgery. Representative images of three animals are shown from n=5 mice for SRC-3-WT, S857A, and shPFKFB4; and n=4 mice for shSRC-3. Residual or recurrence tumors at primary sites were masked with black paper to visualize lung lesions. d, Histology images showing lung sections stained with hematoxylin and eosin (H&E). Arrows indicate micro metastasis lesions. Scale bar 100µm. Data shown are representative of four fields per slide from n=5 animals per group. e, Immunohistochemical (IHC) images from primary tumors demonstrating pSRC-3-S857 expression (red) co-stained with DAPI (blue). Scale bar: 100 µm. Magnified image in the box shows the tumor boundary as indicated by the dotted line. Scale bar: 200 µm. f, Quantification of nuclear-stained pSRC-3-S857 in each groups. Average of four fields per slide from n=5 mice per group. [Mean (center) ± s.d. (errors), One-way ANOVA with Dunnett's multiple comparisons test.]. For exact P-values please refer to source data.

Comment in

Similar articles

Cited by

References

    1. Ward PS, Thompson CB. Metabolic reprogramming: a cancer hallmark even warburg did not anticipate. Cancer. Cell. 2012;21:297–308. - PMC - PubMed
    1. Dang CV. Cancer cell metabolism: there is no ROS for the weary. Cancer. Discov. 2012;2:304–307. - PubMed
    1. Gojis O, et al. The role of SRC-3 in human breast cancer. Nat. Rev. Clin. Oncol. 2010;7:83–89. - PubMed
    1. Anzick SL, et al. AIB1, a steroid receptor coactivator amplified in breast and ovarian cancer. Science. 1997;277:965–968. - PubMed
    1. Xu J, Wu RC, O'Malley BW. Normal and cancer-related functions of the p160 steroid receptor co-activator (SRC) family. Nat. Rev. Cancer. 2009;9:615–630. - PMC - PubMed

Publication types

MeSH terms

  NODES
INTERN 1
Project 1
twitter 2