Transcription Factor Binding Site Enrichment Analysis in Co-Expression Modules in Celiac Disease
- PMID: 29748492
- PMCID: PMC5977185
- DOI: 10.3390/genes9050245
Transcription Factor Binding Site Enrichment Analysis in Co-Expression Modules in Celiac Disease
Abstract
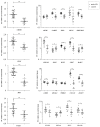
The aim of this study was to construct celiac co-expression patterns at a whole genome level and to identify transcription factors (TFs) that could drive the gliadin-related changes in coordination of gene expression observed in celiac disease (CD). Differential co-expression modules were identified in the acute and chronic responses to gliadin using expression data from a previous microarray study in duodenal biopsies. Transcription factor binding site (TFBS) and Gene Ontology (GO) annotation enrichment analyses were performed in differentially co-expressed genes (DCGs) and selection of candidate regulators was performed. Expression of candidates was measured in clinical samples and the activation of the TFs was further characterized in C2BBe1 cells upon gliadin challenge. Enrichment analyses of the DCGs identified 10 TFs and five were selected for further investigation. Expression changes related to active CD were detected in four TFs, as well as in several of their in silico predicted _targets. The activation of TFs was further characterized in C2BBe1 cells upon gliadin challenge, and an increase in nuclear translocation of CAMP Responsive Element Binding Protein 1 (CREB1) and IFN regulatory factor-1 (IRF1) in response to gliadin was observed. Using transcriptome-wide co-expression analyses we are able to propose novel genes involved in CD pathogenesis that respond upon gliadin stimulation, also in non-celiac models.
Keywords: celiac disease; co-expression; complex disease; gene regulation; transcription factor.
Conflict of interest statement
The authors declare no conflict of interest.
Figures


Similar articles
-
Enhanced expression of interferon regulatory factor-1 in the mucosa of children with celiac disease.Pediatr Res. 2003 Sep;54(3):312-8. doi: 10.1203/01.PDR.0000079184.70237.9C. Epub 2003 Jun 4. Pediatr Res. 2003. PMID: 12788988
-
Differential co-expression analysis of rheumatoid arthritis with microarray data.Mol Med Rep. 2014 Nov;10(5):2421-6. doi: 10.3892/mmr.2014.2491. Epub 2014 Aug 14. Mol Med Rep. 2014. PMID: 25118911
-
IL-15 interferes with suppressive activity of intestinal regulatory T cells expanded in Celiac disease.Am J Gastroenterol. 2011 Jul;106(7):1308-17. doi: 10.1038/ajg.2011.80. Epub 2011 Apr 5. Am J Gastroenterol. 2011. PMID: 21468011
-
Profiling Celiac Disease-Related Transcriptional Changes.Int Rev Cell Mol Biol. 2018;336:149-174. doi: 10.1016/bs.ircmb.2017.07.003. Epub 2017 Sep 18. Int Rev Cell Mol Biol. 2018. PMID: 29413889 Review.
-
AGA Clinical Practice Update on Diagnosis and Monitoring of Celiac Disease-Changing Utility of Serology and Histologic Measures: Expert Review.Gastroenterology. 2019 Mar;156(4):885-889. doi: 10.1053/j.gastro.2018.12.010. Epub 2018 Dec 19. Gastroenterology. 2019. PMID: 30578783 Free PMC article. Review.
Cited by
-
Coexistence of apoptosis, pyroptosis, and necroptosis pathways in celiac disease.Clin Exp Immunol. 2023 Dec 13;214(3):328-340. doi: 10.1093/cei/uxad082. Clin Exp Immunol. 2023. PMID: 37455655 Free PMC article.
-
Limonin inhibits angiogenesis and metastasis of human breast cancer cells by suppressing the VEGFR2/IGFR1-mediated STAT3 signaling pathway.Transl Cancer Res. 2020 Nov;9(11):6820-6832. doi: 10.21037/tcr-20-1992. Transl Cancer Res. 2020. PMID: 35117291 Free PMC article.
References
-
- Van Heel D.A., Franke L., Hunt K.A., Gwilliam R., Zhernakova A., Inouye M., Wapenaar M.C., Barnardo M.C., Bethel G., Holmes G.K., et al. A genome-wide association study for celiac disease identifies risk variants in the region harboring IL2 and IL21. Nat. Genet. 2007;39:827–829. doi: 10.1038/ng2058. - DOI - PMC - PubMed
-
- Trynka G., Hunt K.A., Bockett N.A., Romanos J., Mistry V., Szperl A., Bakker S.F., Bardella M.T., Bhaw-Rosun L., Castillejo G., et al. Dense genotyping identifies and localizes multiple common and rare variant association signals in celiac disease. Nat. Genet. 2011;43:1193–1201. doi: 10.1038/ng.998. - DOI - PMC - PubMed
Grants and funding
LinkOut - more resources
Full Text Sources
Other Literature Sources
Research Materials

