CD8+ T cells mediate the antitumor activity of frankincense and myrrh in hepatocellular carcinoma
- PMID: 29784005
- PMCID: PMC5963062
- DOI: 10.1186/s12967-018-1508-5
CD8+ T cells mediate the antitumor activity of frankincense and myrrh in hepatocellular carcinoma
Abstract
Background: Tumor-promoting inflammation is an emerging hallmark of cancer, which participates in both cancer progression and immune escape. Hepatocellular carcinoma (HCC) is a typical inflammation-related cancer with an extremely poor prognosis. Frankincense and myrrh are anti-inflammation agents commonly used in clinic. The purpose of this study is to investigate whether extract of frankincense and myrrh (FM) downregulates inflammatory microenvironment of HCC and thereby restores antitumor immune responses.
Methods: The water-decocting FM was obtained and quantified. HCC cell lines HCCLM3 and Hepa1-6 were used to evaluate the efficacy of FM _targeting NF-κB and STAT3 signaling with western blot and qRT-PCR analysis. CD8+NKG2D+ cells were derived from human peripheral blood and were used for evaluation of immune cells-mediated inflammation and oncolysis on HCCLM3 cells. The antitumor efficacy of FM was investigated both in immune compromised and immune competent mice bearing subcutaneous HCC. Mice received daily oral gavage of FM at 60 mg/kg. Immune activity within tumor microenvironment (TME) was assessed by ELISpot assay and flow cytometry, respectively. Depletion of CD8+ T cells or NK cells was achieved by intraperitoneal injection of respective neutralizing antibody.
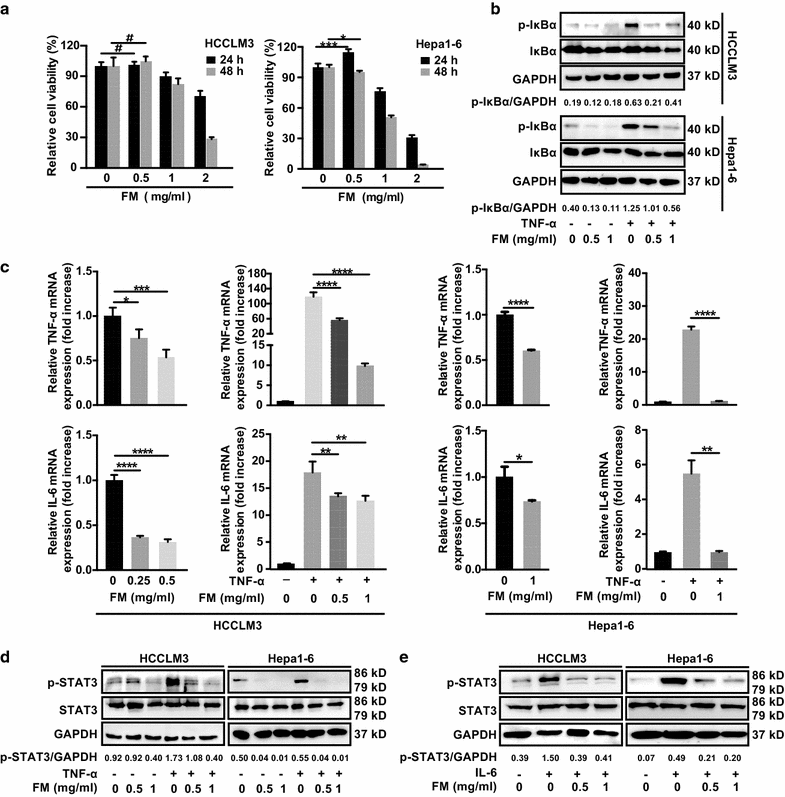
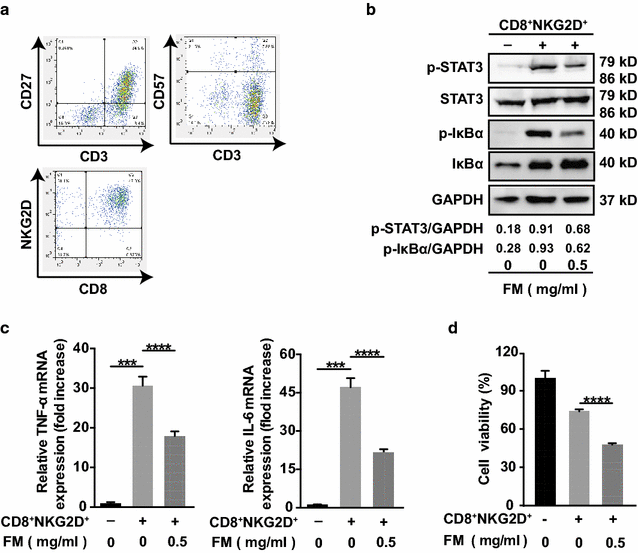
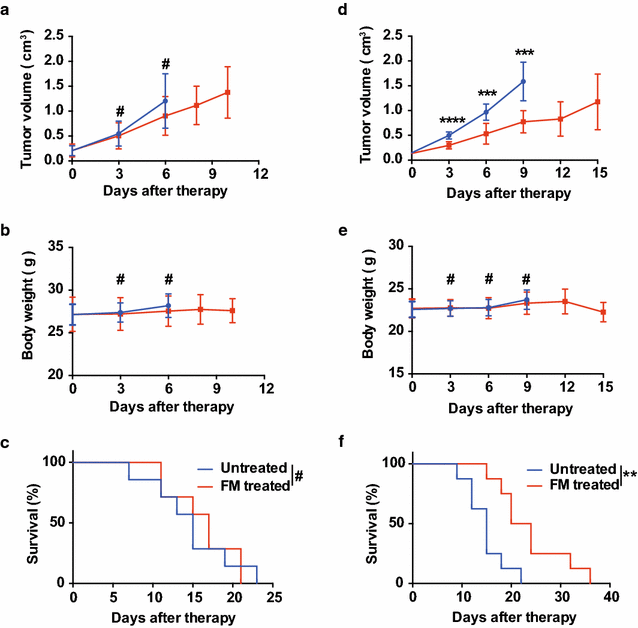
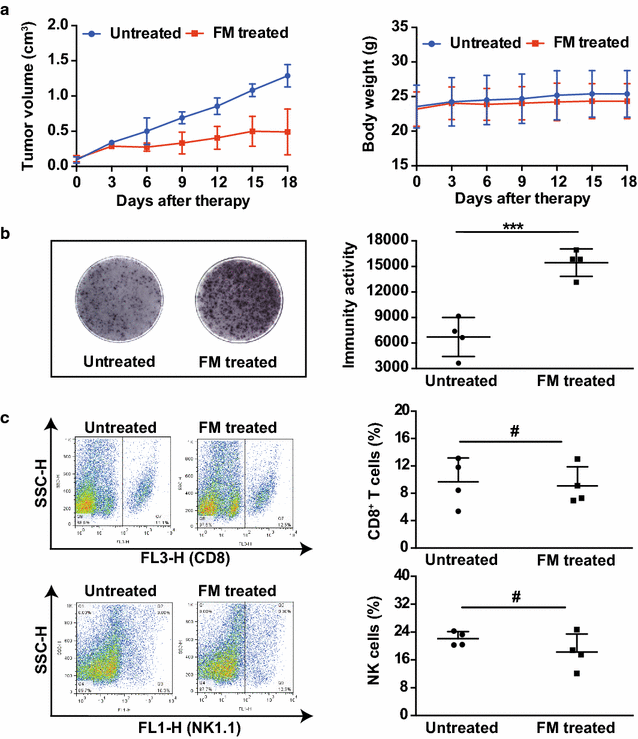
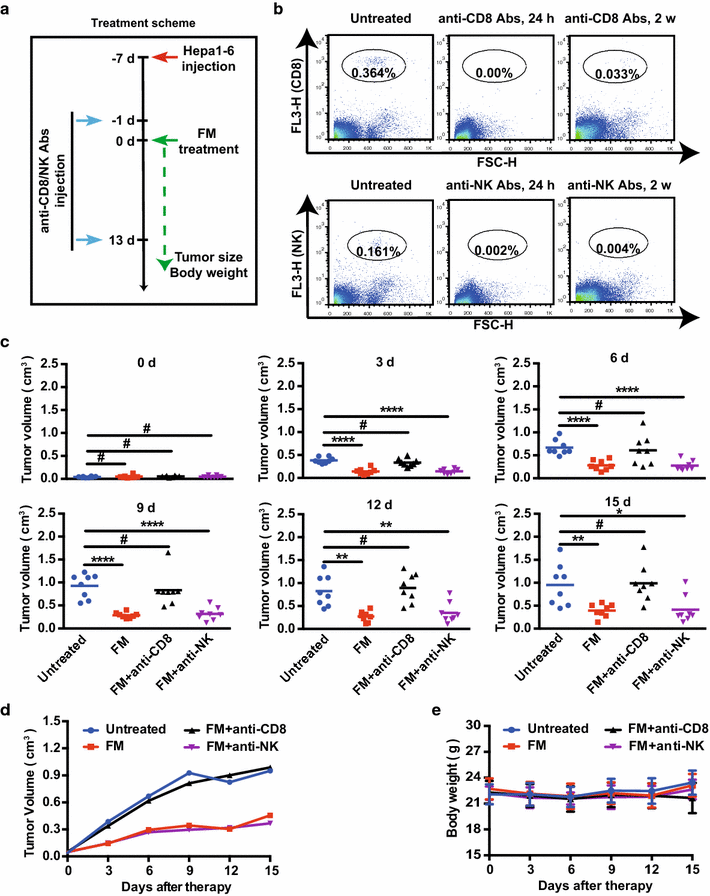
Results: FM significantly inhibited the activation of NF-κB and STAT3 signaling in HCC cells induced by cytokines (TNF-α or IL-6) and in co-culture system with CD8+NKG2D+ cells. Furthermore, FM sensitized HCC cells to CD8+NKG2D+ cells-mediated oncolysis. In HCC-bearing mice, FM at a non-toxic dose failed to reduce tumor growth in immune compromised mice, whereas it significantly inhibited tumor growth and prolonged life span in immune competent mice. While the number of IFN-γ-producing cells within TME was increased in mice treated with FM, the infiltration of CD8+ T cells and NK cells was not increased. Finally, we identified that depletion of CD8+ T cells rather than NK cells abrogated the antitumor activity of FM.
Conclusions: Our results show for the first time that CD8+ T cells mediate the antitumor activity of FM at a non-toxic dose. This may provide new insights to this ancient mysterious prescription in cancer therapy, which offers a novel and practical therapeutic strategy and the possibilities of combined immunotherapy for HCC as well as other inflammation-related cancers in clinic.
Keywords: Antitumor immunity; Cancer-related inflammation; Frankincense; Hepatocellular carcinoma; Myrrh; NF-κB/STAT3 signaling.
Figures
Similar articles
-
The anti-inflammatory NHE-06 restores antitumor immunity by _targeting NF-κB/IL-6/STAT3 signaling in hepatocellular carcinoma.Biomed Pharmacother. 2018 Jun;102:420-427. doi: 10.1016/j.biopha.2018.03.099. Epub 2018 Mar 22. Biomed Pharmacother. 2018. PMID: 29574282
-
Recombinant adenovirus expressing the fusion protein PD1PVR improves CD8+ T cell-mediated antitumor efficacy with long-term tumor-specific immune surveillance in hepatocellular carcinoma.Cell Oncol (Dordr). 2021 Dec;44(6):1243-1255. doi: 10.1007/s13402-021-00633-w. Epub 2021 Sep 7. Cell Oncol (Dordr). 2021. PMID: 34491549
-
Oncolytic measles virus enhances antitumour responses of adoptive CD8+NKG2D+ cells in hepatocellular carcinoma treatment.Sci Rep. 2017 Jul 12;7(1):5170. doi: 10.1038/s41598-017-05500-z. Sci Rep. 2017. PMID: 28701757 Free PMC article.
-
An update review on Commiphora molmol and related species.J Egypt Soc Parasitol. 2008 Dec;38(3):763-96. J Egypt Soc Parasitol. 2008. PMID: 19209761 Review.
-
Role of Immune Cells in Patients with Hepatitis B Virus-Related Hepatocellular Carcinoma.Int J Mol Sci. 2021 Jul 27;22(15):8011. doi: 10.3390/ijms22158011. Int J Mol Sci. 2021. PMID: 34360777 Free PMC article. Review.
Cited by
-
Protective Effect and Mechanism of Boswellic Acid and Myrrha Sesquiterpenes with Different Proportions of Compatibility on Neuroinflammation by LPS-Induced BV2 Cells Combined with Network Pharmacology.Molecules. 2019 Oct 31;24(21):3946. doi: 10.3390/molecules24213946. Molecules. 2019. PMID: 31683684 Free PMC article.
-
Enhancement of Curcumin Anti-Inflammatory Effect via Formulation into Myrrh Oil-Based Nanoemulgel.Polymers (Basel). 2021 Feb 14;13(4):577. doi: 10.3390/polym13040577. Polymers (Basel). 2021. PMID: 33672981 Free PMC article.
-
Seeing the Unseen of the Combination of Two Natural Resins, Frankincense and Myrrh: Changes in Chemical Constituents and Pharmacological Activities.Molecules. 2019 Aug 24;24(17):3076. doi: 10.3390/molecules24173076. Molecules. 2019. PMID: 31450584 Free PMC article. Review.
-
Current Perspective of Traditional Chinese Medicines and Active Ingredients in the Therapy of Hepatocellular Carcinoma.J Hepatocell Carcinoma. 2022 Feb 9;9:41-56. doi: 10.2147/JHC.S346047. eCollection 2022. J Hepatocell Carcinoma. 2022. PMID: 35178363 Free PMC article. Review.
-
Myrrh induces the apoptosis and inhibits the proliferation and migration of gastric cancer cells through down-regulating cyclooxygenase-2 expression.Biosci Rep. 2020 May 29;40(5):BSR20192372. doi: 10.1042/BSR20192372. Biosci Rep. 2020. PMID: 32364228 Free PMC article.
References
Publication types
MeSH terms
Substances
Grants and funding
LinkOut - more resources
Full Text Sources
Other Literature Sources
Medical
Research Materials
Miscellaneous

