Quantification of subclonal selection in cancer from bulk sequencing data
- PMID: 29808029
- PMCID: PMC6475346
- DOI: 10.1038/s41588-018-0128-6
Quantification of subclonal selection in cancer from bulk sequencing data
Erratum in
-
Author Correction: Quantification of subclonal selection in cancer from bulk sequencing data.Nat Genet. 2018 Sep;50(9):1342. doi: 10.1038/s41588-018-0169-x. Nat Genet. 2018. PMID: 30022114
Abstract
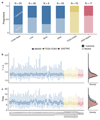
Subclonal architectures are prevalent across cancer types. However, the temporal evolutionary dynamics that produce tumor subclones remain unknown. Here we measure clone dynamics in human cancers by using computational modeling of subclonal selection and theoretical population genetics applied to high-throughput sequencing data. Our method determined the detectable subclonal architecture of tumor samples and simultaneously measured the selective advantage and time of appearance of each subclone. We demonstrate the accuracy of our approach and the extent to which evolutionary dynamics are recorded in the genome. Application of our method to high-depth sequencing data from breast, gastric, blood, colon and lung cancer samples, as well as metastatic deposits, showed that detectable subclones under selection, when present, consistently emerged early during tumor growth and had a large fitness advantage (>20%). Our quantitative framework provides new insight into the evolutionary trajectories of human cancers and facilitates predictive measurements in individual tumors from widely available sequencing data.
Figures


Similar articles
-
Subclonal diversification of primary breast cancer revealed by multiregion sequencing.Nat Med. 2015 Jul;21(7):751-9. doi: 10.1038/nm.3886. Epub 2015 Jun 22. Nat Med. 2015. PMID: 26099045 Free PMC article.
-
SubClonal Hierarchy Inference from Somatic Mutations: Automatic Reconstruction of Cancer Evolutionary Trees from Multi-region Next Generation Sequencing.PLoS Comput Biol. 2015 Oct 5;11(10):e1004416. doi: 10.1371/journal.pcbi.1004416. eCollection 2015 Oct. PLoS Comput Biol. 2015. PMID: 26436540 Free PMC article.
-
The Subclonal Architecture of Metastatic Breast Cancer: Results from a Prospective Community-Based Rapid Autopsy Program "CASCADE".PLoS Med. 2016 Dec 27;13(12):e1002204. doi: 10.1371/journal.pmed.1002204. eCollection 2016 Dec. PLoS Med. 2016. PMID: 28027312 Free PMC article.
-
Principles of Reconstructing the Subclonal Architecture of Cancers.Cold Spring Harb Perspect Med. 2017 Aug 1;7(8):a026625. doi: 10.1101/cshperspect.a026625. Cold Spring Harb Perspect Med. 2017. PMID: 28270531 Free PMC article. Review.
-
CONIPHER: a computational framework for scalable phylogenetic reconstruction with error correction.Nat Protoc. 2024 Jan;19(1):159-183. doi: 10.1038/s41596-023-00913-9. Epub 2023 Nov 28. Nat Protoc. 2024. PMID: 38017136 Review.
Cited by
-
Clonal tracing reveals diverse patterns of response to immune checkpoint blockade.Genome Biol. 2020 Oct 15;21(1):263. doi: 10.1186/s13059-020-02166-1. Genome Biol. 2020. PMID: 33059736 Free PMC article.
-
In Silico Investigations of Multi-Drug Adaptive Therapy Protocols.Cancers (Basel). 2022 May 30;14(11):2699. doi: 10.3390/cancers14112699. Cancers (Basel). 2022. PMID: 35681680 Free PMC article.
-
Multiscale heterogeneity in gastric adenocarcinoma evolution is an obstacle to precision medicine.Genome Med. 2021 Nov 8;13(1):177. doi: 10.1186/s13073-021-00975-y. Genome Med. 2021. PMID: 34749812 Free PMC article.
-
Tipping Cancer Cells Over the Edge: The Context-Dependent Cost of High Ploidy.Cancer Res. 2022 Mar 1;82(5):741-748. doi: 10.1158/0008-5472.CAN-21-2794. Cancer Res. 2022. PMID: 34785577 Free PMC article.
-
Deterministic evolution and stringent selection during preneoplasia.Nature. 2023 Jun;618(7964):383-393. doi: 10.1038/s41586-023-06102-8. Epub 2023 May 31. Nature. 2023. PMID: 37258665 Free PMC article.
References
-
- Durrett R. Branching Process Models of Cancer. Springer; 2015.
Publication types
MeSH terms
Grants and funding
LinkOut - more resources
Full Text Sources
Other Literature Sources

