The advantages of linear concentration-response curves for in vitro bioassays with environmental samples
- PMID: 29846006
- PMCID: PMC6150494
- DOI: 10.1002/etc.4178
The advantages of linear concentration-response curves for in vitro bioassays with environmental samples
Abstract
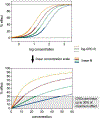
In vitro assays and high-throughput screening (HTS) tools are increasingly being employed as replacements for animal testing, but most concentration-response curves are still evaluated with models developed for animal testing. We argue that application of in vitro assays, particularly reporter gene assays, to environmental samples can benefit from a different approach to concentration-response modeling. First, cytotoxicity often occurs at higher concentrations, especially for weakly acting compounds and in complex environmental mixtures with many components. In these cases, specific effects can be masked by cytotoxicity. Second, for many HTS assays, low effect levels can be precisely quantified because of the low variability of controls in cell-based assays and the opportunity to run many concentrations and replicates when using high-density well-plate formats (e.g., 384 or more wells per plate). Hence, we recommend focusing concentration-response modeling on the lower portion of the concentration-response curve, which is approximately linear. Effect concentrations derived from low-effect level linear concentration-response models facilitate simple derivation of relative effect potencies and the correct application of mixture toxicity models in the calculation of bioanalytical equivalent concentrations. Environ Toxicol Chem 2018;37:2273-2280. © 2018 SETAC.
Keywords: Bioanalytical equivalent concentration; Dose-response modeling; Environmental toxicology; In vitro toxicology.
© 2018 SETAC.
Figures


Similar articles
-
Exploring the Concepts of Concentration Addition and Independent Action Using a Linear Low-Effect Mixture Model.Environ Toxicol Chem. 2020 Dec;39(12):2552-2559. doi: 10.1002/etc.4868. Epub 2020 Oct 22. Environ Toxicol Chem. 2020. PMID: 32897547
-
Development of a bioanalytical test battery for water quality monitoring: Fingerprinting identified micropollutants and their contribution to effects in surface water.Water Res. 2017 Oct 15;123:734-750. doi: 10.1016/j.watres.2017.07.016. Epub 2017 Jul 9. Water Res. 2017. PMID: 28728110
-
The agonistic bioanalytical equivalent concentration: A novel tool for assessing the endocrine activity of environmental mixtures.Environ Toxicol Pharmacol. 2022 Jan;89:103781. doi: 10.1016/j.etap.2021.103781. Epub 2021 Dec 3. Environ Toxicol Pharmacol. 2022. PMID: 34871798
-
High-throughput screening and environmental risk assessment: State of the science and emerging applications.Environ Toxicol Chem. 2019 Jan;38(1):12-26. doi: 10.1002/etc.4315. Epub 2018 Dec 20. Environ Toxicol Chem. 2019. PMID: 30570782 Free PMC article. Review.
-
Big data in chemical toxicity research: the use of high-throughput screening assays to identify potential toxicants.Chem Res Toxicol. 2014 Oct 20;27(10):1643-51. doi: 10.1021/tx500145h. Epub 2014 Sep 16. Chem Res Toxicol. 2014. PMID: 25195622 Free PMC article. Review.
Cited by
-
Wastewater treatment efficacy evaluated with in vitro bioassays.Water Res X. 2020 Oct 1;9:100072. doi: 10.1016/j.wroa.2020.100072. eCollection 2020 Dec 1. Water Res X. 2020. PMID: 33089130 Free PMC article.
-
Reactivity of Acrylamides Causes Cytotoxicity and Activates Oxidative Stress Response.Chem Res Toxicol. 2023 Aug 21;36(8):1374-1385. doi: 10.1021/acs.chemrestox.3c00115. Epub 2023 Aug 2. Chem Res Toxicol. 2023. PMID: 37531411 Free PMC article.
-
A novel anti Candida albicans drug screening system based on high-throughput microfluidic chips.Sci Rep. 2019 May 30;9(1):8087. doi: 10.1038/s41598-019-44298-w. Sci Rep. 2019. PMID: 31147583 Free PMC article.
-
Influence of Co-Dosed Lipids from Biota Extracts on the Availability of Chemicals in In Vitro Cell-Based Bioassays.Environ Sci Technol. 2020 Apr 7;54(7):4240-4247. doi: 10.1021/acs.est.9b07850. Epub 2020 Mar 16. Environ Sci Technol. 2020. PMID: 32118404 Free PMC article.
-
Water, Water Everywhere, but Every Drop Unique: Challenges in the Science to Understand the Role of Contaminants of Emerging Concern in the Management of Drinking Water Supplies.Geohealth. 2023 Dec 28;7(12):e2022GH000716. doi: 10.1029/2022GH000716. eCollection 2023 Dec. Geohealth. 2023. PMID: 38155731 Free PMC article. Review.
References
-
- Brand W, De Jongh CM, van Linden SC, Mennes W, Puijker LM, van Leeuwen C, van Wezel A, Schriks M, Heringa M. 2013. Trigger values for investigation of hormonal activity in drinking water and its sources using CALUX bioassays. Environ Internat 55:109–118. - PubMed
-
- Brinkmann M, Hecker M, Giesy JP, Jones PD, Ratte HT, Hollert H, Preuss TG. 2018. Generalized concentration addition accurately predicts estrogenic potentials of mixtures and environmental samples containing partial agonists. Toxicol in Vitro 46:294–303. - PubMed
-
- Buchinger S, Grill P, Morosow V, Ben-Yoav H, Shacham-Diamand Y, Biran A, Pedahzur R, Belkin S, Reifferscheid G. 2010. Evaluation of chrono-amperometric signal detection for the analysis of genotoxicity by a whole cell biosensor. Anal Chim Act 659:122–128. - PubMed
Publication types
MeSH terms
Substances
Grants and funding
LinkOut - more resources
Full Text Sources
Other Literature Sources
