. 2018 Jul 3;8(1):10067.
doi: 10.1038/s41598-018-28389-8.

SSPIM: a beam shaping toolbox for structured selective plane illumination microscopy

Affiliations

SSPIM: a beam shaping toolbox for structured selective plane illumination microscopy

Mostafa Aakhte et al. Sci Rep. .

Abstract

Selective plane illumination microscopy (SPIM) represents a preferred method in dynamic tissue imaging, because it combines high spatiotemporal resolution with low phototoxicity. The OpenSPIM system was developed to provide an accessible and flexible microscope set-up for non-specialist users. Here, we report Structured SPIM (SSPIM), which offers an open-source, user-friendly and compact toolbox for beam shaping to be applied within the OpenSPIM platform. SSPIM is able to generate digital patterns for a wide range of illumination beams including static and spherical Gaussian beams, Bessel beams and Airy beams by controlling the pattern of a Spatial Light Modulator (SLM). In addition, SSPIM can produce patterns for structured illumination including incoherent and coherent array beams and tiling for all types of the supported beams. We describe the workflow of the toolbox and demonstrate its application by comparing experimental data with simulation results for a wide range of illumination beams. Finally, the capability of SSPIM is investigated by 3D imaging of Drosophila embryos using scanned Gaussian, Bessel and array beams. SSPIM provides an accessible toolbox to generate and optimize the desired beam patterns and helps adapting the OpenSPIM system towards a wider range of biological samples.


Conflict of interest statement

The authors declare no competing interests.

Figures

Figure 1
Figure 1
Schematic of the SPIM set up and demonstration of the illumination beams. The choice of the illumination beam depends on the size and the transparency of the biological sample. (a) Schematic of a conventional SPIM set up in which the illumination objective lens (IOL) generates a thin sheet within the x-y plane of the sample. The emission light is collected with the detection objective lens (DOL) in the orthogonal direction (z axis). The image was produced using the Fusion360 (AutodeskR). (bi) Show simulations of the principle beam structures that can be achieved using SSPIM. (b,c) The transverse intensity of a static Gaussian beam (b) and of a 1D Airy beam (c). (df) Intensity profiles of a single Gaussian beam (d) and a Bessel beam (e) with radial symmetry and a 2D Airy beam (f) with asymmetrical intensity profile. (gi) Beam arrays and lattice beam; (g) Gaussian beam array; (h) Bessel beam array; (i) Lattice beam. The simulations in (di) were generated using MATLAB (MathWorksR).
Figure 2
Figure 2
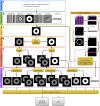
The workflow of SSPIM. A flow diagram is depicted that describes the successive steps and options in SSPIM that are available for the user when designing bespoken beam shapes. (a) In the first step, the user has to define the SLM parameters and the illumination wavelength. (b) The desired beam can be selected from six beam types using the mask selection menu. (c) As an example, the selected mask in this workflow is an annular mask in order to create a Bessel beam. (d) If the optical setup needs to separate the constant diffraction pattern of the SLM from the desired patterned hologram, a blaze grating (or binary grating for binary SLM) has to be selected. (e) To apply the tiling method, two or more quadratic phases can be added to the phase map; this will result in tiling the optical beam in the direction of the illumination. (f) In the next step, the user is able to add a binary Dammann grating to the phase map in order to generate a beam array. In step (b), if the user selects the “lattice”, another sub-menu (the lattice workflow) will be opened for creating an SLM pattern for a lattice beam. (gi) In the lattice workflow, an ideal 2D lattice (square and hexagonal) (g), the bounding function (h) and the bound lattice (i) will be calculated. (j) The diffraction pattern of the bound lattice pattern will be predicted. (k) An annular mask selects the desired spatial frequency of the bound lattice. (l,m) The beam intensity at the rear pupil of the IOL and in front of the focal plane of the IOL will be predicted. If the SLM is conjugated into the rear pupil, the bound binary lattice (i) will be selected as the SLM pattern. The calculated rear pupil intensity pattern (l) will be set as the selected mask. Then, all steps from (d) to (f) can be processed. In general, the output of the toolbox in step (f) can be used as an SLM pattern for beam shaping. The user is also able to truncate the phase map with an amplitude mask. In addition, the final SLM pattern can be saved for binary or gray-scale SLM.
Figure 3
Figure 3
SSPIM output for single beams. (a,b) The binary pattern and recorded cross-section intensities of the static Gaussian beam (a1,a2) and 1D Airy beam (b1,b2) are depicted, respectively. (c1,d1,e1) The calculated SLM patterns to create the circular Gaussian beam (c), the Bessel beam (d) and the 2D Airy beam (e). (c2,d2,e2) Measurements of the beam propagation intensity through a dye solution. (c3,d3,e3) Recorded cross–sections of the beams. Scale bars: 20 μm.
Figure 4
Figure 4
SSPIM output for array and lattice beams. (a1,b1) The binary patterns are applied to tune the SLM for the generation of the 7-array Gaussian beam (a1) and the 7-array Bessel beam (b1). (a2,b2) The recorded propagation intensity of the Gaussian beam array (a2) and the Bessel beam array (b2) through dye solution are depicted. (a3,b3) Measurements of the intensities of the beam arrays in a cross-section. (c1,d1) SLM patterns to generate the square lattice beams with different bounding functions. (c2,d2) Measurements of the intensities of the square lattice beams in a cross-section. (e1,f1) SLM pattern to generate the hexagonal lattice beams with different bounding functions. (e2,f2) Measurements of the intensities of the hexagonal lattice beams in cross-section. Scale bars: 20 μm.
Figure 5
Figure 5
SSPIM output for the tiling method. The images provide examples for the SLM masks (a1,a3,a5,b1,b3,b5) and the measurements of the intensities of the beam propagation through a dye solution (a2,a4,a6, b2,b4,b6). (a1,a3,a5) SLM patterns for the application of tiling of a single beam in three steps. (a2,a4,a6) Measurements of the propagations of the tiled beams. (b1,b3,b5) SLM patterns to tiling an array composed of 5-beams in three steps. (b2,b4,b6) Recorded intensity propagations of the tiled beam array. Scale bars: 40 μm.
Figure 6
Figure 6
Improvement of spatial resolution in SPIM imaging with engineered illumination beams using SSPIM. Drosophila embryos were fixed and immunolabeled with antibodies against the membrane protein Dlg. (a, upper panels) Images of a Drosophila embryo recorded with SPIM using a scanned Gaussian, a Bessel beam and a scanned square lattice beam, as indicated. (a, lower panels). The axial view of the recorded data are depicted at different depths (x1 and x2). (b) The increased resolution using the lattice beam is demonstrated by enlarged views and the line intensity profiles of the axial views in (a). The graphs (right hand panels) show differences in the resolution using the three different beam types. Black arrows mark different areas in which the resolution using the lattice beam (blue line) was significantly better compared to imaging performed in the same area with either the Gaussian beam (green line) or the Bessel beam (purple line). (c) The spatial resolution was improved by using an engineered lattice beam. Fourier analysis of the axial view of recorded images show that the radius of the cut-off frequency is increased by using the lattice beam by approximately 40% compared to the Gaussian beam and 30% compared to the Bessel beam. Scale bars: 15 μm.

Similar articles

Cited by

References

    1. Huisken J, Swoger J, Filippo Del Bene F, Wittbrodt J, Stelzer EHK. Optical sectioning deep inside live embryos by selective plane illumination microscopy. Science. 2004;305:1007–1009. doi: 10.1126/science.1100035. - DOI - PubMed
    1. Fahrbach FO, Simon P, Rohrbach A. Microscopy with self-reconstructing beams. Nat. Photonics. 2010;4:780–785. doi: 10.1038/nphoton.2010.204. - DOI
    1. Huisken J, Stainier DYR. Even fluorescence excitation by multidirectional selective plane illumination microscopy (mSPIM) Optics letters. 2007;32(no. 17):2608–2610. doi: 10.1364/OL.32.002608. - DOI - PubMed
    1. Keller PJ, Schmidt AD, Wittbrodt J, Stelzer EHK. Reconstruction of zebrafish early embryonic development by scanned light sheet microscopy. Science. 2008;322:1065–1069. doi: 10.1126/science.1162493. - DOI - PubMed
    1. Planchon TA, et al. Rapid three-dimensional isotropic imaging of living cells using Bessel beam plane illumination. Nat. Methods. 2011;8:417–423. doi: 10.1038/nmeth.1586. - DOI - PMC - PubMed

Publication types

LinkOut - more resources

  NODES
3d 1
HOME 2
Idea 1
idea 1
Javascript 1
mac 2
os 46
text 12
twitter 2
Users 1
visual 1
web 4