Global Involvement of Lysine Crotonylation in Protein Modification and Transcription Regulation in Rice
- PMID: 30021883
- PMCID: PMC6166680
- DOI: 10.1074/mcp.RA118.000640
Global Involvement of Lysine Crotonylation in Protein Modification and Transcription Regulation in Rice
Abstract
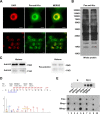
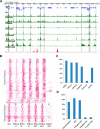
Lysine crotonylation (Kcr) is a newly discovered posttranslational modification (PTM) existing in mammals. A global crotonylome analysis was undertaken in rice (Oryza sativa L. japonica) using high accuracy nano-LC-MS/MS in combination with crotonylated peptide enrichment. A total of 1,265 lysine crotonylation sites were identified on 690 proteins in rice seedlings. Subcellular localization analysis revealed that 51% of the crotonylated proteins identified were localized in chloroplasts. The photosynthesis-associated proteins were also mostly enriched in total crotonylated proteins. In addition, a genomic localization analysis of histone Kcr by ChIP-seq was performed to assess the relevance between histone Kcr and the genome. Of the 10,923 identified peak regions, the majority (86.7%) of the enriched peaks were located in gene body, especially exons. Furthermore, the degree of histone Kcr modification was positively correlated with gene expression in genic regions. Compared with other published histone modification data, the Kcr was co-located with the active histone modifications. Interestingly, histone Kcr-facilitated expression of genes with existing active histone modifications. In addition, 77% of histone Kcr modifications overlapped with DNase hypersensitive sites (DHSs) in intergenic regions of the rice genome and might mark other cis-regulatory DNA elements that are different from IPA1, a transcription activator in rice seedlings. Overall, our results provide a comprehensive understanding of the biological functions of the crotonylome and new active histone modification in transcriptional regulation in plants.
Keywords: Epigenetics; Histones; Oryza sativa; Photosynthesis; Protein Modification; Transcriptional Regulation; crotonyl lysine; histone lysine crotonylation; post-translational modification.
© 2018 Liu et al.
Conflict of interest statement
The authors declare that they have no conflicts of interest
Figures


Similar articles
-
Dynamics and functional interplay of histone lysine butyrylation, crotonylation, and acetylation in rice under starvation and submergence.Genome Biol. 2018 Sep 25;19(1):144. doi: 10.1186/s13059-018-1533-y. Genome Biol. 2018. PMID: 30253806 Free PMC article.
-
Global Proteome Analyses of Lysine Acetylation and Succinylation Reveal the Widespread Involvement of both Modification in Metabolism in the Embryo of Germinating Rice Seed.J Proteome Res. 2016 Mar 4;15(3):879-90. doi: 10.1021/acs.jproteome.5b00805. Epub 2016 Jan 28. J Proteome Res. 2016. PMID: 26767346
-
Large-scale lysine crotonylation analysis reveals its potential role in spermiogenesis in the Chinese mitten crab Eriocheir sinensis.J Proteomics. 2020 Aug 30;226:103891. doi: 10.1016/j.jprot.2020.103891. Epub 2020 Jul 4. J Proteomics. 2020. PMID: 32629196
-
Lysine crotonylation: A challenging new player in the epigenetic regulation of plants.J Proteomics. 2022 Mar 20;255:104488. doi: 10.1016/j.jprot.2022.104488. Epub 2022 Jan 20. J Proteomics. 2022. PMID: 35065287 Review.
-
Emerging roles of non-histone protein crotonylation in biomedicine.Cell Biosci. 2021 May 31;11(1):101. doi: 10.1186/s13578-021-00616-2. Cell Biosci. 2021. PMID: 34059135 Free PMC article. Review.
Cited by
-
Lysine crotonylation is widespread on proteins of diverse functions and localizations in Toxoplasma gondii.Parasitol Res. 2021 May;120(5):1617-1626. doi: 10.1007/s00436-021-07057-3. Epub 2021 Mar 3. Parasitol Res. 2021. PMID: 33655350
-
The crotonylated and succinylated proteins of jujube involved in phytoplasma-stress responses.BMC Biol. 2024 May 15;22(1):113. doi: 10.1186/s12915-024-01917-x. BMC Biol. 2024. PMID: 38750524 Free PMC article.
-
Global crotonylatome and GWAS revealed a TaSRT1-TaPGK model regulating wheat cold tolerance through mediating pyruvate.Sci Adv. 2023 May 10;9(19):eadg1012. doi: 10.1126/sciadv.adg1012. Epub 2023 May 10. Sci Adv. 2023. PMID: 37163591 Free PMC article.
-
Protein lysine crotonylation: past, present, perspective.Cell Death Dis. 2021 Jul 14;12(7):703. doi: 10.1038/s41419-021-03987-z. Cell Death Dis. 2021. PMID: 34262024 Free PMC article. Review.
-
Proteome-Wide Analysis of Lysine 2-Hydroxyisobutyrylated Proteins in Fusarium oxysporum.Front Microbiol. 2021 Feb 10;12:623735. doi: 10.3389/fmicb.2021.623735. eCollection 2021. Front Microbiol. 2021. PMID: 33643252 Free PMC article.
References
-
- Deribe Y. L., Pawson T., and Dikic I. (2010) Post-translational modifications in signal integration. Nat. Struct. Mol. Biol. 17, 666–672 - PubMed
-
- Azevedo C., and Saiardi A. (2016) Why always lysine? The ongoing tale of one of the most modified amino acids. Advances Biolog. Reg. 60, 144–150 - PubMed
-
- Zhao S., Xu W., Jiang W., Yu W., Lin Y., Zhang T., Yao J., Zhou L., Zeng Y., Li H., Li Y., Shi J., An W., Hancock S. M., He F., Qin L., Chin J., Yang P., Chen X., Lei Q., Xiong Y., and Guan K. L. (2010) Regulation of cellular metabolism by protein lysine acetylation. Science 327, 1000–1004 - PMC - PubMed
Publication types
MeSH terms
Substances
LinkOut - more resources
Full Text Sources
Other Literature Sources

