. 2018 Sep 6;23(3):343-354.e5.
doi: 10.1016/j.stem.2018.06.008. Epub 2018 Jul 19.

Loss of H3K27me3 Imprinting in Somatic Cell Nuclear Transfer Embryos Disrupts Post-Implantation Development

Affiliations

Loss of H3K27me3 Imprinting in Somatic Cell Nuclear Transfer Embryos Disrupts Post-Implantation Development

Shogo Matoba et al. Cell Stem Cell. .

Abstract

Animal cloning can be achieved through somatic cell nuclear transfer (SCNT), although the live birth rate is relatively low. Recent studies have identified H3K9me3 in donor cells and abnormal Xist activation as epigenetic barriers that impede SCNT. Here we overcome these barriers using a combination of Xist knockout donor cells and overexpression of Kdm4 to achieve more than 20% efficiency of mouse SCNT. However, post-implantation defects and abnormal placentas were still observed, indicating that additional epigenetic barriers impede SCNT cloning. Comparative DNA methylome analysis of IVF and SCNT blastocysts identified abnormally methylated regions in SCNT embryos despite successful global reprogramming of the methylome. Strikingly, allelic transcriptomic and ChIP-seq analyses of pre-implantation SCNT embryos revealed complete loss of H3K27me3 imprinting, which may account for the postnatal developmental defects observed in SCNT embryos. Together, these results provide an efficient method for mouse cloning while paving the way for further improving SCNT efficiency.

Keywords: DNA methylation; H3K27me3-dependent imprinting; animal cloning; epigenetic reprogramming; genomic imprinting; mouse embryo; somatic cell nuclear transfer.


Conflict of interest statement

DECLARATION OF INTERESTS

Y.Z. is a scientific founder of NewStem Biotechnology. Y.Z. and S.M. are inventors of a patent regarding the role of Kdm4 in improving cloning efficiency.

Figures

Figure 1.
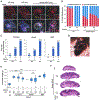
Figure 1.. Combined Use of Xist KO Donor Cells and Kdm4d mRNA Injection Does Not Completely Restore the Developmental Potential of SCNT Embryos
(A) Representative images of IVF and SCNT blastocysts stained with anti-H3K27me3, anti-Cdx2, and anti-Oct4 antibodies and DAPI. Arrows indicate punctate H3K27me3 signals representing ectopically inactivated X chromosomes. Three to five embryos were examined for each condition. XX and XY represent female and male, respectively. Note that the ectopic XCIs can be observed regardless of Kdm4d mRNA injection. Scale bar, 50 μm. (B) Bar graphs showing the ratio of cells with or without punctate H3K27me3 signals (representing inactivated X chromosomes) in IVF and SCNT blastocysts. Each column represents a single blastocyst. XX and XY represent female and male, respectively. (C) Bar graphs showing the pup rate of SCNT embryos examined by cesarian section on E19.5. Note that a combination of using Xist KO donor cells with Kdm4d mRNA injection additively improves the term rate of SCNT embryos with cumulus cells, Sertoli cells, and MEF cells as donors, n represents the number of embryos transferred to pseudopregnant females. (D) An image of an adult male mouse derived by SCNT using Xist KO Sertoli cells combined with Kdm4d mRNA injection, and its pups, generated through natural mating with a wild-type female. (E) Boxplots showing the weight of placentae examined by cesarian section on E19.5. The whiskers represent the maximum and minimum, n represents the number of placentae examined. The p value was calculated by t test. ***p < 0.001. ns, not significant. (F) Representative images of histological sections of a term placenta stained with periodic acid-Schiff (PAS). Microscopic images for each sample were combined into a single panel by adjusting the scale. Note that the PAS-positive spongiotrophoblast layer has invaded the labyrinthine layer in the SCNT placenta regardless of the genotype of the Xist allele in donor cells. Scale bar, 1mm. See also Figure S1 and Table S1.
Figure 2.
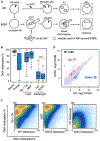
Figure 2.. Extensive Reprogramming of DNA Methylation in SCNT Blastocysts
(A) Schematic illustration of the experimental approach. Blastocysts generated by IVF or SCNT (combination of Xist KO donor and Kdm4d injection) were used for whole-genome bisulfite sequencing (WGBS) and RNA-seq. (B) Boxplots comparing the DNA methylation levels of all covered CpGs across the genome of SCNT and IVF blastocysts as well as MEFs, zygotes, sperm, and oocytes. In this and subsequent box plots, thick lines in boxes indicate the medians, red crosses stand for the mean, and the whiskers represent the 2.5th and 97.5th percentiles. ***p < 2.2e–16 by t test. Sp+Oo represents the average value of sperm and oocytes. WGBS datasets of MEF, sperm, and oocytes were obtained from GEO: GSE56151 and GEO: GSE56697. (C) Scatterplot comparing the DNA methylation levels between each sample. Note that the heavily methylated donor MEF cell genome is globally reprogrammed by SCNT, resulting in a similar DNA methylation profile as that of IVF blastocysts. (D) Scatterplot comparing the gene expression profiles of IVF and SCNT blastocysts. Genes upregulated (Up, FC > 3.0) and downregulated (Down, FC > 3.0) in SCNT embryos are colored red and blue, respectively. See also Figure S2 and Table S2.
Figure 3.
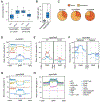
Figure 3.. Identification and Characterization of DMRs in SCNT Blastocysts
(A) Boxplots showing the DNA methylation levels of SCNT and IVF blastocysts at hyper- and hypoDMRs. Thick lines in boxes indicate the medians, and red crosses stand for the mean. The number of DMRs is also indicated. (B) Boxplots comparing the lengths of hyper- and hypoDMRs. (C) Pie chart distribution of hyper- and hypoDMRs in the genome. (D) Average DNA methylation levels of the indicated samples at hypoDMRs compared with their flanking regions. (E) Paternal (Pat) and maternal (Mat) allele-specific DNA methylation levels of IVF and SCNT blastocysts at hypoDMRs compared with their flanking regions (F) Pat and Mat allele-specific DNA methylation levels of IVF and SCNT embryos at the indicated developmental stages at hypoDMRs compared with their flanking regions. (G) Average DNA methylation levels of the indicated samples at hyperDMRs compared with their flanking regions. (H) Average DNA methylation levels of the indicated samples at hyperDMRs compared with their flanking regions. Datasets used were from GEO: GSE11034. See also Figure S3 and Table S3.
Figure 4.
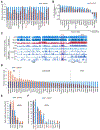
Figure 4.. Imprinting Status of the Canonical Imprinting Genes and Their ICRs
(A) Bar graphs showing relative DNA methylation levels of the 23 known imprinting control regions (ICRs) in SCNT blastocysts. The methylation level of IVF blastocysts was set as 1. The dashed line indicates 50% of the IVF blastocyst methylation level. Note that 21 of 23 ICRs maintained at least 50% of the IVF methylation levels in SCNT blastocysts, but Snrpn-Snurf and Slc38a4 ICRs (marked as red) showed less than 50% that of the IVF level. (B) Bar graph showing allelic bias of DNA methylation at 20 ICRs with sufficient allele-specific methylation information (more than 5 detected CpGs in both alleles of both IVF and SCNT blastocysts). Note that most ICRs maintained allelic biased DNA methylation in SCNT blastocysts, except the Impact ICR. (C) Genome browser view showing DNA methylation levels flanking the Dlk1-Meg3 ICR on mouse chromosome 12, The red box represents the Dlk1-Meg3 ICR (Tomizawa et al., 2011). Note that the paternally biased DNA methylation pattern at the Dlk1-Meg3 ICR is maintained in SCNT embryos. M, maternal allele; P, paternal allele. (D) Bar graphs showing relative gene expression levels of known imprinted genes in SCNT blastocysts. Shown are 45 imprinted genes reliably detectable in IVF blastocysts (FPKM >1). The expression level of IVF blastocysts was set as 1. Genes were classified as up, down, and unchanged based on their expression levels in SCNT embryos compared with IVF embryos (FC > 1.5). (E) Bar graphs showing the ratio of allelic expression (Mat divided by Pat) of known imprinted genes in IVF and SCNT blastocysts. Shown are 6 maternally expressed genes (MEGs; Mat/Pat > 2.0) that are expressed at a reliably detectable level with sufficient SNP-tracked reads (FPKM > 1, mean SNP reads > 10 in either sample) in IVF blastocysts. Asterisks represent 100% bias to the Mat allele. Note that all 6 MEGs maintained Mat allelic bias in SCNT blastocysts. (F) Bar graphs showing the ratio of allelic expression (Pat divided by Mat) of known imprinted genes in IVF and SCNT blastocysts. Shown are 13 paternally expressed genes (PEGs; Pat divided by Mat > 2.0) that are expressed at a reliably detectable level with sufficient SNP-tracked reads (FPKM > 1, mean SNP reads > 10 in either sample) in IVF blastocysts. Asterisks represent 100% bias to the Pat allele. Arrows indicate genes that lost Pat biased expression in SCNT blastocysts. Red marks indicate H3K27me3-dependent imprinted genes. See also Figure S4 and Table S4.
Figure 5.
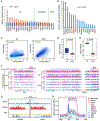
Figure 5.. Loss of H3K27me3-Dependent Imprinting in SCNT Blastocysts
(A) Bar graphs showing relative gene expression levels of H3K27me3-imprinted genes in SCNT blastocysts. Shown are the 26 genes expressed in IVF blastocyst at a reliably detectable level (FPKM > 1). The expression level of IVF blastocysts was set as 1. Genes were classified as up, down, and unchanged by expression changes in SCNT compared with that in IVF blastocysts (FC > 1.5). (B) Bar graphs showing the ratio (Pat divided by Mat) of allelic expression of the H3K27me3-imprinted genes in IVF and SCNT blastocysts. Among the 26 expressed genes (FPKM > 1), 17 genes with more than 10 SNP reads in either sample are shown. The asterisk represents 100% bias to the Pat allele. Note that all 17 genes lost their Pat allelic bias in SCNT blastocysts. (C) Scatterplots comparing Mat and Pat H3K27me3 values at 4,135 Mat PI3K27me3-domains identified in IVF embryos. Note that the Mat bias of H3K27me3 at these domains is lost in SCNT embryos. (D) Boxplots comparing the ratio (Mat/Pat) of allelic H3K27me3 enrichment at the 4,135 Mat H3K27me3 domains in IVF and SCNT morulae. The p value was calculated by t test. (E) Boxplots comparing the ratio (Mat/Pat) of allelic H3K27me3 enrichment at the 76 H3K27me3-dependent imprinted genes in IVF and SCNT morulae. The p value was calculated by t test. (F) Genome browser view of H3K27me3 ChIP-seq signals at two H3K27me3-dependent imprinted genes, Gab1 and Sfmbt2. (G) Genome browser views of H3K27me3 ChIP-seq signals at representative H3K27me3-dependent imprinted genes in sperm, oocytes, and MEF cells. (H) The average H3K27me3 ChIP-seq intensity of various cell types (oocytes, sperm, MEFs, and embryonic stem cells [ESCs]) and tissues at the 76 H3K27me3-imprinted genes compared with 3-Mb flanking regions. Datasets used were from GEO: GSE49847 and GEO: GSE76687. See also Figure S5 and Table S5.

Similar articles

Cited by

References

    1. Acampora D, Mazan S, Lallemand Y, Avantaggiato V, Maury M, Simeone A, and Brûlet P (1995). Forebrain and midbrain regions are deleted in Otx2−/− mutants due to a defective anterior neuroectoderm specification during gastrulation. Development 121, 3279–3290. - PubMed
    1. Ao Z, Liu D, Zhao C, Yue Z, Shi J, Zhou R, Cai G, Zheng E, Li Z, and Wu Z (2017). Birth weight, umbilical and placental traits in relation to neonatal loss in cloned pigs. Placenta 57, 94–101. - PubMed
    1. Branco MR, King M, Perez-Garcia V, Bogutz AB, Caley M, Fineberg E, Lefebvre L, Cook SJ, Dean W, Hemberger M, and Reik W (2016). Maternal DNA Methylation Regulates Early Trophoblast Development. Dev. Cell 36, 152–163. - PMC - PubMed
    1. Brind’Amour J, Liu S, Hudson M, Chen C, Karimi MM, and Lorincz MC (2015). An ultra-low-input native ChIP-seq protocol for genome-wide profiling of rare cell populations. Nat. Commun 6, 6033. - PubMed
    1. Chan MM. Smith ZD, Egli D, Regev A, and Meissner A (2012). Mouse ooplasm confers context-specific reprogramming capacity. Nat. Genet 44, 978–980. - PMC - PubMed

Publication types

  NODES
Note 9
Project 1
twitter 2