. 2018 Sep 17;84(19):e00823-18.
doi: 10.1128/AEM.00823-18. Print 2018 Oct 1.

Multiple Optimal Phenotypes Overcome Redox and Glycolytic Intermediate Metabolite Imbalances in Escherichia coli pgi Knockout Evolutions

Affiliations

Multiple Optimal Phenotypes Overcome Redox and Glycolytic Intermediate Metabolite Imbalances in Escherichia coli pgi Knockout Evolutions

Douglas McCloskey et al. Appl Environ Microbiol. .

Abstract

A mechanistic understanding of how new phenotypes develop to overcome the loss of a gene product provides valuable insight on both the metabolic and regulatory functions of the lost gene. The pgi gene, whose product catalyzes the second step in glycolysis, was deleted in a growth-optimized Escherichia coli K-12 MG1655 strain. The initial knockout (KO) strain exhibited an 80% drop in growth rate that was largely recovered in eight replicate, but phenotypically distinct, cultures after undergoing adaptive laboratory evolution (ALE). Multi-omic data sets showed that the loss of pgi substantially shifted pathway usage, leading to a redox and sugar phosphate stress response. These stress responses were overcome by unique combinations of innovative mutations selected for by ALE. Thus, the coordinated mechanisms from genome to metabolome that lead to multiple optimal phenotypes after the loss of a major gene product were revealed.IMPORTANCE A mechanistic understanding of how microbes are able to overcome the loss of a gene through regulatory and metabolic changes is not well understood. Eight independent adaptive laboratory evolution (ALE) experiments with pgi knockout strains resulted in eight phenotypically distinct endpoints that were able to overcome the gene loss. Utilizing multi-omics analysis, the coordinated mechanisms from genome to metabolome that lead to multiple optimal phenotypes after the loss of a major gene product were revealed.

Keywords: Escherichia coli; adaptive laboratory evolution; multi-omics analysis; mutation analysis; pgi gene knockout; systems biology.


Figures

FIG 1
FIG 1
Evolution of knockout (KO) strains from a preevolved (i.e., optimized) wild-type strain. (A) Wild-type (wt) E. coli (MG1655 K-12) was previously evolved on glucose minimal medium at 37°C (16). An isolate from the endpoint of the evolutionary experiment was selected as the starting strain for subsequent KO of pgi and adaptive laboratory evolution (ALE). (B) Adaptive laboratory evolution trajectories of the evolved knockout lineages. Omics data were collected from the fresh KO, and endpoint lineages included metabolomics, fluxomics, physiology, DNA resequencing, and transcriptomics. (C) Phosphoglucose isomerase (PGI) was disabled by the gene KO. PGI is the first step in glycolysis and converts glucose 6-phosphate (G6P) to fructose 6-phosphate (F6P). (D) Growth rate and glucose (glc-d) uptake and acetate (ac) excretion rates for unevolved KO (uPgi) and evolved KOs (ePgi). Error bars denote 95% confidence intervals from biological triplicates. succ, succinate.
FIG 2
FIG 2
Changes in flux splits pre- and postadaptive evolution. (A) Network diagram with reactions involved in flux splits annotated. Reactions included phosphogluconate dehydratase (EDD), 6-phosphogluconate dehydrogenase (GND), 6-phosphogluconolactonase (PGL), phosphoenolpyruvate carboxylase (PPC), phosphoenolpyruvate carboxylase kinase (PPCK), malate dehydrogenase (MALS), NADP-dependent malic enzyme 1 (ME1), NAD-dependent malic enzyme (ME2), citrate synthase (CS), acetate secretion (ACt2rpp), pyruvate dehydrogenase (PDH), conversion of cis-aconitate to isocitrate (icit) carried out by the second step of the aconitase enzyme (ACONTb), isocitrate dehydrogenase (ICDHyr), and isocitrate lyase (ICL). PFK3, phosphofructokinase 3; TKT1, transketolase 1. (B) Measured absolute fluxes for the Ref strain, uPgi, and ePgi strains. Values are derived from averages taken from triplicate cultures that were analyzed in duplicate (n = 6).
FIG 3
FIG 3
An imbalance in redox carriers. (A) Box-and-whisker plots of log-normalized absolute metabolite levels (μmol · gram dry cell weight [gDCW]−1 norm) of the redox carriers NAD(P)(H) and the reduced (gthrd) and oxidized (gthox) glutathione. Network diagram of the interconversion of nadh to nad, nadp to nadph, and gthox and nadph to gthrd and nadp. An imbalance in glycolytic and PPP intermediates and their downstream biosynthetic components are shown. (B) Schematic of the connection between the PPP precursor ribose 5-phosphate (r5p) and downstream amino acid and nucleotides l-histidine (his-l), IMP, and UMP. Box-and-whisker plots of absolute metabolite levels of r5p, his-l, imp, and ump. (C) Schematic of the connection between the glycolytic precursor phosphoenol pyruvate (PEP) and downstream aromatic amino acids l-tryptophan (trp-l), l-tyrosine (tyr-l), and l-phenylalanine (phe-l). Box-and-whisker plots of PEP, trp-l, tyr-l, and phe-l. Values are derived from averages taken from triplicate cultures that were analyzed in duplicate (n = 6).
FIG 4
FIG 4
KO of PGI led to a hexose phosphate toxicity response. The magnitude of G6P in the initial knockout led to a deleterious cycle whereby leakage of hexose phosphate across the inner membrane (31, 32) induced hexose phosphate reuptake via the uhpBC two-component system and uhpT hexose phosphate transporter gene (28–30). (A) A network map and regulatory schematic of the reactions into and out of the G6P node. The reaction in red is removed through the PGI KO. (B) A mechanistic schematic of the uhpBC two-component system that sensed periplasmic hexose phosphate. The transcription factor UphA positively upregulated the expression of the hexose phosphate importer gene uhpT. (C) Metabolite, expression, and flux levels near the node of perturbation. Abnormal elevations in glucose 6-phosphate (G6P) and imbalance of the glycolytic intermediates in pgi were found to induce a sugar phosphate toxicity response sensed through sgrR and mediated through the action of the small RNA sgrS (6–8) (as depicted in panels A and B). (D and E) Regulatory schematic of genes (sgrR and sgrST-setA operons) subjected to transcriptional activation or attenuation by the small RNA sgrS (7, 20, 74, 75). (F) Gene expression profiles of sugar phosphate response genes. Note the elevations in G6P and corresponding upregulation of sgrS in response to activation of SgrR by G6P that is consistent with the literature (7, 20, 74, 75). Metabolite concentrations are derived from averages taken from triplicate cultures that were analyzed in duplicate (n = 6). Gene expression values are derived from averages of biological duplicates.
FIG 5
FIG 5
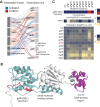
An in-frame 33-nucleotide deletion (DEL) that removed 11 amino acids in the small-molecule-binding domain of galR negates galR repression in ePgi07. (A) Regulatory network specifically controlled by cAMP-CRP, galR, and galS (76–78). cAMP-CRP can both positively and negatively regulate the expression of galR, galS, galETKM, galP, and mglBAC; GalR and GalS act as repressors; and GalR and GalS bound to galactose active primarily as activators. (B) Crystal structure of the galR transcription factor (70). The position of the deletion is highlighted in red, the small-molecule-binding domain is highlighted in cyan, and the H-T-H DNA-binding region is highlighted in magenta. Images created using the VMD software tool (v. 1.9.2; http://www.ks.uiuc.edu/Research/vmd/). (C) Mutation frequency for galR, metabolite concentration for cAMP, and expression profiles of galR-controlled operons. Note the increased expression of galP and galETKM in ePgi07. Metabolite concentrations are derived from averages taken from triplicate cultures that were analyzed in duplicate (n = 6). Gene expression values are derived from averages of biological duplicates.
FIG 6
FIG 6
A mobile element insertion (MOB) that truncated the MalT TF in ePgi06 was found that appeared to silence the expression of MalT-controlled operons. (A) Schematic of the malT operon (39) and truncated MalT peptide. The mobile element insertion introduced a stop codon that reduced the MalT peptide from 901 amino acids to 29 amino acids. All binding domains and catalytic sites were cleaved (40, 41). (B) Operons controlled by malT (39). All regulators except malT and CRP-cAMP have been omitted. MalT-controlled genes are involved in glycogen turnover and may give ePgi06 an advantage in controlling the levels of hexose phosphates that are converted to and broken down from glycogen. (C) Mutation frequency of malT, metabolite concentration for cAMP, and expression profiles for malT and malT-regulated genes. Note the significantly repressed gene expression levels of MalT-controlled genes in ePgi06. Metabolite concentrations are derived from averages taken from triplicate cultures that were analyzed in duplicate (n = 6). Gene expression values are derived from averages of biological duplicates.
FIG 7
FIG 7
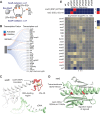
Mutations in soxR and rseC that altered the expression of oxidative stress genes. (A) Protein-protein interaction schema between SoxR and Rsx-RseC. In the reduced form, the iron sulfur clusters of the SoxR homodimers sense the presence of free radicals and ROS (79, 80). The oxidation of the iron sulfur clusters by free radicals and ROS induces a conformation changes from the inactive form to the active form (81). While both reduced and inactive forms and oxidized and active forms of SoxR are capable of binding DNA, only the active form is capable of activating or inhibiting transcription (43, 82–85). The Rsx-RseC complex prevents reduction and inactivation of SoxR (46). (B) Regulatory schematic of a subset of SoxR and SoxS-controlled operons. (C) Crystal structure of SoxR (86). The soxR single-nucleotide polymorphism (SNP) eliminated the Fe-S cluster binding site of the SoxR peptide. The SoxR DNA-binding region in proximity to single-stranded DNA (sDNA) is shown below. (D) Crystal structure of rseC. The rseC mutation cleaved a large portion of the transmembrane helix region that may affect Rsx-RseC complex formation or activity. The mutated and/or cleaved residues are shown in red. AAs, amino acids. Images in panels C and D were created using the VMD software tool (v. 1.9.2; http://www.ks.uiuc.edu/Research/vmd/). (E) Mutation frequency and gene expression profiles. Gene expression values are derived from averages of biological duplicates.
FIG 8
FIG 8
Mutations in the soluble sthA (50) and membrane-bound pntB (51) transhydrogenases that potentially aid in balancing NAD(P)(H) cofactors. (A) Schematic of the sthA and pntAB operons. (B) Network diagrams of the soluble pyridine nucleotide transhydrogenase (NADTRHD) reaction catalyzed by sthA and the membrane-bound pyridine nucleotide transhydrogenase (THD2pp) reaction catalyzed by pntAB. (C) Mutation frequency and metabolite and expression levels near the genes. (D) The sthA mutation in ePgi04 appeared near the dimerization domain and may affect enzyme complex formation. (E) The pntB mutation in ePgi07 appeared in the transmembrane region and may affect catalytic activity or membrane association. It has been demonstrated that the altered activities of sthA and pntAB confer a fitness advantage in pgi mutant strains by rebalancing the ratios of NADH to NADPH (47, 48). Metabolite concentrations are derived from averages taken from triplicate cultures that were analyzed in duplicate (n = 6). Gene expression values are derived from averages of biological duplicates. Images in panels D and E were created using the VMD software tool (v. 1.9.2; http://www.ks.uiuc.edu/Research/vmd/).
FIG 9
FIG 9
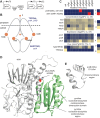
A beneficial mutation that rewired the TCA cycle via a cofactor usage swap in isocitrate dehydrogenase (ICD) aided in alleviating the excessive conversion of NADP to NADPH. (A) Network schematic of a segment of the TCA cycle. The reaction in red is catalyzed by ICD. (B) Crystal structure of ICD. The mutated amino acids are highlighted in yellow. (C) Zoom-in on the active site of isocitrate dehydrogenase showing the proximity of the mutated amino acid to the phosphate group of NADP. The mutation occurs 4 Å from the phosphate moiety of NADPH. Residue 395 has been shown to be directly involved in NADPH binding (52) and appears to allow the mutated enzyme to utilize NADH as a cofactor. Images in panels B and C were created using the VMD software tool (v. 1.9.2; http://www.ks.uiuc.edu/Research/vmd/). (D) Mutation frequency and metabolite, expression, and flux levels near the mutated gene. System components near the ICDHyr reaction in the ICD mutant strains are significantly changed. Metabolite concentrations are derived from averages taken from triplicate cultures that were analyzed in duplicate (n = 6). Flux levels are derived from averages taken from triplicate cultures that were analyzed in duplicate (n = 6). Gene expression values are derived from averages of biological duplicates.

Similar articles

Cited by

References

    1. Usui Y, Hirasawa T, Furusawa C, Shirai T, Yamamoto N, Mori H, Shimizu H. 2012. Investigating the effects of perturbations to pgi and eno gene expression on central carbon metabolism in Escherichia coli using 13C metabolic flux analysis. Microb Cell Fact 11:87. doi:10.1186/1475-2859-11-87. - DOI - PMC - PubMed
    1. Ahn J, Chung BKS, Lee D-Y, Park M, Karimi IA, Jung J-K, Lee H. 2011. NADPH-dependent pgi-gene knockout Escherichia coli metabolism producing shikimate on different carbon sources. FEMS Microbiol Lett 324:10–16. doi:10.1111/j.1574-6968.2011.02378.x. - DOI - PubMed
    1. Charusanti P, Conrad TM, Knight EM, Venkataraman K, Fong NL, Xie B, Gao Y, Palsson BØ. 2010. Genetic basis of growth adaptation of Escherichia coli after deletion of pgi, a major metabolic gene. PLoS Genet 6:e1001186. doi:10.1371/journal.pgen.1001186. - DOI - PMC - PubMed
    1. Fong SS, Nanchen A, Palsson BO, Sauer U. 2006. Latent pathway activation and increased pathway capacity enable Escherichia coli adaptation to loss of key metabolic enzymes. J Biol Chem 281:8024–8033. doi:10.1074/jbc.M510016200. - DOI - PubMed
    1. Ishii N, Nakahigashi K, Baba T, Robert M, Soga T, Kanai A, Hirasawa T, Naba M, Hirai K, Hoque A, Ho PY, Kakazu Y, Sugawara K, Igarashi S, Harada S, Masuda T, Sugiyama N, Togashi T, Hasegawa M, Takai Y, Yugi K, Arakawa K, Iwata N, Toya Y, Nakayama Y, Nishioka T, Shimizu K, Mori H, Tomita M. 2007. Multiple high-throughput analyses monitor the response of E. coli to perturbations. Science 316:593–597. doi:10.1126/science.1132067. - DOI - PubMed

Publication types

MeSH terms

Substances

LinkOut - more resources

  NODES
Association 1
Note 4
twitter 2