Caloric restriction inhibits mammary tumorigenesis in MMTV-ErbB2 transgenic mice through the suppression of ER and ErbB2 pathways and inhibition of epithelial cell stemness in premalignant mammary tissues
- PMID: 30107476
- PMCID: PMC6175030
- DOI: 10.1093/carcin/bgy096
Caloric restriction inhibits mammary tumorigenesis in MMTV-ErbB2 transgenic mice through the suppression of ER and ErbB2 pathways and inhibition of epithelial cell stemness in premalignant mammary tissues
Abstract
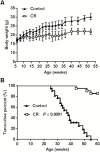
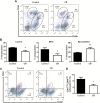
Caloric intake influences the onset of many diseases, including cancer. In particular, caloric restriction (CR) has been reported to suppress mammary tumorigenesis in various models. However, the underlying cancer preventive mechanisms have not been fully explored. To this end, we aimed to characterize the anticancer mechanisms of CR using MMTV-ErbB2 transgenic mice, a well-established spontaneous ErbB2-overexpressing mammary tumor model, by focusing on cellular and molecular changes in premalignant tissues. In MMTV-ErbB2 mice with 30% CR beginning at 8 weeks of age, mammary tumor development was dramatically inhibited, as exhibited by reduced tumor incidence and increased tumor latency. Morphogenic mammary gland analyses in 15- and 20-week-old mice indicated that CR significantly decreased mammary epithelial cell (MEC) density and proliferative index. To understand the underlying mechanisms, we analyzed the effects of CR on mammary stem/progenitor cells. Results from fluorescence-activated cell sorting analyses showed that CR modified mammary tissue hierarchy dynamics, as evidenced by decreased luminal cells (CD24highCD49flow), putative mammary reconstituting unit subpopulation (CD24highCD49fhigh) and luminal progenitor cells (CD61highCD49fhigh). Mammosphere and colony-forming cell assays demonstrated that CR significantly inhibited mammary stem cell self-renewal and progenitor cell numbers. Molecular analyses indicated that CR concurrently inhibited estrogen receptor (ER) and ErbB2 signaling. These molecular changes were accompanied by decreased mRNA levels of ER-_targeted genes and epidermal growth factor receptor/ErbB2 family members and ligands, suggesting ER-ErbB2 signaling cross-talk. Collectively, our data demonstrate that CR significantly impacts ER and ErbB2 signaling, which induces profound changes in MEC reprogramming, and mammary stem/progenitor cell inhibition is a critical mechanism of CR-mediated breast cancer prevention.
Figures


Similar articles
-
Buformin inhibits the stemness of erbB-2-overexpressing breast cancer cells and premalignant mammary tissues of MMTV-erbB-2 transgenic mice.J Exp Clin Cancer Res. 2017 Feb 13;36(1):28. doi: 10.1186/s13046-017-0498-0. J Exp Clin Cancer Res. 2017. PMID: 28193239 Free PMC article.
-
FGFR inhibitor, AZD4547, impedes the stemness of mammary epithelial cells in the premalignant tissues of MMTV-ErbB2 transgenic mice.Sci Rep. 2017 Sep 12;7(1):11306. doi: 10.1038/s41598-017-11751-7. Sci Rep. 2017. PMID: 28900173 Free PMC article.
-
Short-term early exposure to lapatinib confers lifelong protection from mammary tumor development in MMTV-erbB-2 transgenic mice.J Exp Clin Cancer Res. 2017 Jan 6;36(1):6. doi: 10.1186/s13046-016-0479-8. J Exp Clin Cancer Res. 2017. PMID: 28061785 Free PMC article.
-
In Utero Exposure to Bisphenol a Promotes Mammary Tumor Risk in MMTV-Erbb2 Transgenic Mice Through the Induction of ER-erbB2 Crosstalk.Int J Mol Sci. 2020 Apr 28;21(9):3095. doi: 10.3390/ijms21093095. Int J Mol Sci. 2020. PMID: 32353937 Free PMC article.
-
The receptor tyrosine kinase EphA2 promotes mammary adenocarcinoma tumorigenesis and metastatic progression in mice by amplifying ErbB2 signaling.J Clin Invest. 2008 Jan;118(1):64-78. doi: 10.1172/JCI33154. J Clin Invest. 2008. PMID: 18079969 Free PMC article.
Cited by
-
The Role of Diet in Cancer Prevention and Chemotherapy Efficacy.Annu Rev Nutr. 2020 Sep 23;40:273-297. doi: 10.1146/annurev-nutr-013120-041149. Epub 2020 Jun 16. Annu Rev Nutr. 2020. PMID: 32543948 Free PMC article. Review.
-
CDK2-mediated site-specific phosphorylation of EZH2 drives and maintains triple-negative breast cancer.Nat Commun. 2019 Nov 8;10(1):5114. doi: 10.1038/s41467-019-13105-5. Nat Commun. 2019. PMID: 31704972 Free PMC article.
-
Endometriosis Stem Cells as a Possible Main _target for Carcinogenesis of Endometriosis-Associated Ovarian Cancer (EAOC).Cancers (Basel). 2022 Dec 24;15(1):111. doi: 10.3390/cancers15010111. Cancers (Basel). 2022. PMID: 36612107 Free PMC article. Review.
-
Fatty Acid Metabolites and the Tumor Microenvironment as Potent Regulators of Cancer Stem Cell Signaling.Metabolites. 2023 May 31;13(6):709. doi: 10.3390/metabo13060709. Metabolites. 2023. PMID: 37367867 Free PMC article. Review.
-
Effect of Maternal Gradient Nutritional Restriction during Pregnancy on Mammary Gland Development in Offspring.Animals (Basel). 2023 Mar 6;13(5):946. doi: 10.3390/ani13050946. Animals (Basel). 2023. PMID: 36899802 Free PMC article.
References
-
- Kemnitz J.W., et al. (1994)Dietary restriction increases insulin sensitivity and lowers blood glucose in rhesus monkeys. Am. J. Physiol., 266 (4 Pt 1), E540–E547. - PubMed
-
- Hursting S.D., et al. (2003)Calorie restriction, aging, and cancer prevention: mechanisms of action and applicability to humans. Annu. Rev. Med., 54, 131–152. - PubMed
Publication types
MeSH terms
Substances
Grants and funding
LinkOut - more resources
Full Text Sources
Other Literature Sources
Molecular Biology Databases
Research Materials
Miscellaneous

