. 2018 Aug 28;9(1):3492.
doi: 10.1038/s41467-018-05449-1.

Phosphorylation of ULK1 affects autophagosome fusion and links chaperone-mediated autophagy to macroautophagy

Affiliations

Phosphorylation of ULK1 affects autophagosome fusion and links chaperone-mediated autophagy to macroautophagy

Chenyao Wang et al. Nat Commun. .

Abstract

The Unc-51 like autophagy activating kinase 1 (ULK1) complex plays a central role in the initiation stage of autophagy. However, the function of ULK1 in the late stage of autophagy is unknown. Here, we report that ULK1, a central kinase of the ULK1 complex involved in autophagy initiation, promotes autophagosome-lysosome fusion. PKCα phosphorylates ULK1 and prevents autolysosome formation. PKCα phosphorylation of ULK1 does not change its kinase activity; however, it decreases autophagosome-lysosome fusion by reducing the affinity of ULK1 for syntaxin 17 (STX17). Unphosphorylated ULK1 recruited STX17 and increased STX17's affinity towards synaptosomal-associated protein 29 (SNAP29). Additionally, phosphorylation of ULK1 enhances its interaction with heat shock cognate 70 kDa protein (HSC70) and increases its degradation through chaperone-mediated autophagy (CMA). Our study unearths a key mechanism underlying autolysosome formation, a process in which the kinase activity of PKCα plays an instrumental role, and reveals the significance of the mutual regulation of macroautophagy and CMA in maintaining the balance of autophagy.


Conflict of interest statement

The authors declare no competing interests.

Figures

Fig. 1
Fig. 1
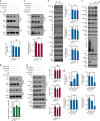
S423 of ULK1 is the phosphorylation site by PKCα. a Phosphorylation of autophagy-related proteins was detected using p-PKC-Substrate antibody. The expression of these proteins is shown in Supplementary Figure 1a. b GST-ULK1 truncations were transfected and the cell lysates were pulled down for WB analysis with p-PKC-substrate antibody. The phosphorylation site is between 279–525AA. c Mapping phosphorylation site of ULK1 by in vitro kinase assay. S423 is the phosphorylation site. d Evolutionary conservation of the ULK1 Ser423. e We generated a p-S423 antibody by ABclonal Technology, and verified the p-S423 antibody by WB. f Phosphorylation site was confirmed by in vitro kinase assay with full-length ULK1. The indicated GST-ULK1s were transfected into HEK293T cells, followed by GST pull down (Step1), Dephosphorylation of the indicated beads by CIP (Step2), PKCα kinase assay (Step3), and CIP treated the whole PVDF membrane to confirm the phosphorylation (Step4). g The phosphorylation of endogenous ULK1 was detected by p-S423 antibody after HEK293T cells were transfected with PKCα WT or DN (dominant negative). h p-ULK1 S423 was analyzed by WB after U87 cells were treated with PKC inhibitors GÖ6983 or Bis I for 0.5 h. p-PKC-substrate antibody was used to determine the efficiency of drugs. Actin, ULK1, and PKCα were used as loading controls. The relative abundance of p-S423 was quantified and shown in the right panel. i U87 cells were infected with lentivirus of non-_targeting or shPKCαs for 48 h. The lysates were analyzed with p-S423 antibody by WB. Quantification of p-S423. The efficiencies of shPKCαs were analyzed by PKCα antibody. Actin was used as loading controls. j p-S423 was determined during serum starvation by WB. p-S423 was consistent with PKCα activity. p-S423 was quantified and is shown in the bottom panel. Statistical significance was measured via unpaired and two-tailed Student’s t-tests and is presented as follows: *p < 0.05, **p < 0.01, and ***p < 0.001. All error bars indicate SEM. Bars are mean ± SEM of triplicate samples. S.S.: serum starvation, WCL: whole-cell lysate, S.E.: short exposure, L.E.: long exposure
Fig. 2
Fig. 2
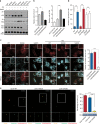
Phosphorylation of ULK1 does not affect the ULLk1 and ATG13 complex and its kinase activity. a Flag-ATG13 was transfected with Myc-ULK1 WT, S423A and S423D into HEK293T cells for 24 h. The IPs were analyzed with Myc antibody. The densities of ATG13 were quantified with image J and showed in the bottom panel. b HA-FIP200 was transfected with Flag-ULK1 WT, S423A, and S423D into HEK293T cells for 24 h. IP was performed with Myc antibody and analyzed with HA antibody. The densities of Fip200 were quantified and showed in the bottom panel. c Flag-BECN1 was transfected with Myc-ULK1 WT, S423A, and S423D or Myc-Control into HEK293T cells for 24 h. IP was performed with Myc antibody and analyzed with Flag antibody. The densities of BECN1 were quantified and showed in the bottom panel. d IP of ULK1 complex partners by Myc-ULK1 variants transfected into HEK293T cells for 24 h was determined with ATG13, Fip200, BECN1 antibodies. The densities of ATG13, Fip200, and BECN1 are quantified and showed in the right panel. e ULK1, PKCα and mTORC1 activities were analyzed by WB after Myc-ULK1 WT and mutants were transfected into HeLa cells for 24 h. The densities of p-ATG13, p-BECN1, and p-ULK1 S757 are quantified and showed in the right panel. f HeLa cells were treated with different concentrations of PKC inhibitor GÖ6983 for 4 h. Lysates were analyzed with the indicated antibodies. g The densities of p-ATG13, p-BECN1, p-ULK1 S757, and p-mTORC1 were quantified from f. Statistical significance was measured via unpaired and two-tailed Student’s t-tests and is presented as follows: NS: no significance; *p < 0.05, **p < 0.01, and ***p < 0.001. All error bars indicate SEM. Bars indicate mean ± SEM of triplicate samples. L-GÖ6983: low concentration, IC50; H-GÖ6983: high concentration, 5*IC50. WCL: whole-cell lysate
Fig. 3
Fig. 3
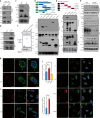
Phosphorylation of ULK1 plays a key role in fusion of autophagosomes to lysosomes. a The control vector, ULK1 WT, S423A, and S423D were transfected into the ULK1/2-KO/D cells and treated with/out Chloroquine (CQ, an lysosomal inhibitor, 20 nM). The lysate was analyzed by WB with LC3, p62 and actin antibodies. b The quantified ratio (CQ-ULK1s/ULK1s) of LC3-Π and p62 is shown. c Representative confocal images of ULK1/2-KO/D HeLa cells transfected with Myc-ULK1 WT and mutants treated with/out CQ shown as the average of puncta per cell. Scale bar, 10 μm. A minimum of 20 cells were counted. d The quantified ratio (CQ-ULK1s/ULK1s) of puncta per cell is shown. e Representative confocal images of in vitro fusion assay. Lysosomes (green) and autophagosomes (red) are mixed with purified GST-ULK1 WT, S423A, and S423D. Scale bar, 5 μm. The fusion percentage was quantified by comparison of the number of yellow dots to the number of red dots and yellow dots. All values are means ± SEM of three independent experiments. Student’s t test (unpaired); NS: no significance; *p < 0.05, **p < 0.01, and ***p < 0.001
Fig. 4
Fig. 4
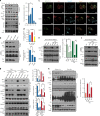
ULK1 physically interacts with STX17. a, b, c Interaction between ULK1 and STX17 were determined using overexpression (a) and endogenous (b, c) proteins to perform IP assay followed by WB with indicated antibodies. d GST-ULK1 was cotransfected with GFP-STX17 fragments into HEK293T cells for 24 h. Pull down with glutathione beads was performed and analyzed with GFP antibody. e The GST-ULK1 truncations were transfected into HeLa cells for 24 h, and pull down with glutathione beads and analyzed with STX17 antibody. f GST-ULK1 279–525 and His-STX17 157–275 were purified from bacteria and incubated with glutathione beads for 4 h. After washing, the elution was analyzed with His antibody. g Myc-ULK1 or Myc vector was cotransfected with GFP-STX17 for 24 h. PLA assay was performed, and the signals (red) were detected under confocal microscopy. Scale bar, 10 μm. h The mice were injected with GÖ6983 (22.0 μg per mouse) or PBS for 7 days via tail vein. IP was performed of liver lysates with STX17 antibody. The IPs were detected by ULK1 antibody. The indicated antibodies were used to confirm drug efficiency. i HeLa cells were transfected with GFP-STX17 and Myc-ULK1 for 24 h with/out serum starvation (S.S.). PLA assay was performed with Myc and GFP antibodies. The fluorescence signal (red) was observed under confocal microscopy. Scale bar, 10 μm. An average signal was quantified with a minimum of 20 cells and is shown in the right bottom panel. j The representative images of PLA assay of GFP-STX17 cotransfected with Myc-ULK1 WT, S423A, S423D, or Myc vector into HeLa cells for 24 h. Scale bar, 10 μm. An average signal was quantified with a minimum of 20 cells and is shown in the left top panel. All values are means ± SEM of three independent experiments. Student’s t-test (unpaired); *p < 0.05, **p < 0.01, ***p < 0.001. WCL: whole-cell lysate
Fig. 5
Fig. 5
Phosphorylation of ULK1 influences the STX17 complex. a HeLa cells were starved and the lysates were performed with IP assay via STX17 antibody and analyzed with ULK1 antibody showed in the right top panel. IPed ULK1 is quantified and showed in the right bottom panel. b ULK1 S423D decreased binding to STX17 compared to WT and S423A by IP assay. In addition, IPed STX17 was quantified. c, d GFP-STX17, Flag-LC3, and Myc-ULK1 variants were cotransfected and detected by immunostaining in HeLa cells (n = 20), and the images were quantified (d). Scale bars, 10 μm. e, f ULK1 S423D affects interactions between STX17 and SNAP29 or VAMP8 with cotransfection and IP assay. The results were analyzed with the indicated antibodies. Bound SNAP29 and VAMP8 were quantified. g myc-ULK1 variant transfected HeLa cells were treated with CQ (100 nM) or PBS. IP assay was performed with STX17 antibody or IgG and detected by indicated antibodies. IPed proteins were quantified. h Lysates from the livers of fasting or normal chew mice were performed by IP assay with STX17 antibody and analyzed with ULK1 antibody. All values are means ± SEM of three independent experiments. Student’s t-test (unpaired); *p < 0.05, **p < 0.01, ***p < 0.001. Baf: bafilomycin a1, WCL: whole-cell lysate
Fig. 6
Fig. 6
Phosphorylation of ULK1 is degraded through chaperone-mediated autophagy. a MG132 (proteasome inhibitor, 20 μm) prevents ULK1 S423A degradation but not degradation of ULK1 WT or S423D. Stable ULK1 WT and mutant HeLa cells were pretreated with cycloheximide (CHX, 20 μg mL−1), an inhibitor of protein synthesis, for 3 h. Then, the cells were treated with MG132 for a time course in the presence of CHX. The remaining ULK1 was detected by WB. b CQ inhibits ULK1 S423D degradation. The procedure is similar to Fig. 6a, but MG132 is replaced by CQ. c Accumulation of more ULK1 in Lamp2-KO cells. The abundance of ULK1 was quantified. d The interaction of ULK1 and HSC70 was determined by pull-down assay with overexpression of GST-ULK1 and HA-HSC70. e The HSC70 binding motif of ULK1 is between Q227 to L231, and the result was verified by double mutations and semi-endogenous co-IP assay by HSC70 antibody. f ULK1 S423D binds more HSC70 and LAMP2a than its counter partners. g Overexpression of HSC70 promotes ULK1 WT and S423Ds degradation, not S423A degradation. h PKCα activity increased the affinity of ULK1 to HSC70 and LAMP2. The results were detected with the indicated antibodies. WCL whole-cell lysate. i ULK1 degraded slowly in LAMP2-KO cells with PMA (a PKC activator) treatment. Myc-tagged ULK1 was transfected into the above two cell lines with the indicated drugs and time course. The remaining ULK1 was quantified. j Mutant ULK1 Q227D228AA prevents p-ULK1 degradation through the lysosome. k The quantification of Fig. 6j. All values are means ± SEM of three independent experiments: *p < 0.05, **p < 0.01, ***p < 0.001. WCL: whole-cell lysate, L.E.: long exposure, S.E.: short exposure
Fig. 7
Fig. 7
Model of ULK1 regulating fusion of macroautophagy and linking chaperone-mediated autophagy to macroautophagy. Unphosphorylated ULK1 recruited STX17 and increased STX17′s affinity towards SNAP29. PKCα phosphorylation of ULK1 attenuates autophagosome–lysosome fusion by reducing the affinity of ULK1 for STX17. Phosphorylation of ULK1 enhances its interaction with HSC70 and increases its degradation via CMA

Similar articles

Cited by

References

    1. Klionsky DJ, et al. Guidelines for the use and interpretation of assays for monitoring autophagy (3rd edition) Autophagy. 2016;12:1–222. doi: 10.1080/15548627.2015.1100356. - DOI - PMC - PubMed
    1. Mizushima N. The role of the Atg1/ULK1 complex in autophagy regulation. Curr. Opin. Cell Biol. 2010;22:132–139. doi: 10.1016/j.ceb.2009.12.004. - DOI - PubMed
    1. Kim J, Kundu M, Viollet B, Guan KL. AMPK and mTOR regulate autophagy through direct phosphorylation of Ulk1. Nat. Cell Biol. 2011;13:132–141. doi: 10.1038/ncb2152. - DOI - PMC - PubMed
    1. Egan D, Kim J, Shaw RJ, Guan KL. The autophagy initiating kinase ULK1 is regulated via opposing phosphorylation by AMPK and mTOR. Autophagy. 2011;7:643–644. doi: 10.4161/auto.7.6.15123. - DOI - PMC - PubMed
    1. Egan DF, et al. Small molecule inhibition of the autophagy kinase ULK1 and identification of ULK1 substrates. Mol. Cell. 2015;59:285–297. doi: 10.1016/j.molcel.2015.05.031. - DOI - PMC - PubMed

Publication types

MeSH terms

LinkOut - more resources

  NODES
INTERN 1
twitter 2