. 2018 Sep 6;19(9):2638.
doi: 10.3390/ijms19092638.

Bradykinin B2 Receptor Contributes to Inflammatory Responses in Human Endothelial Cells by the Transactivation of the Fibroblast Growth Factor Receptor FGFR-1

Affiliations

Bradykinin B2 Receptor Contributes to Inflammatory Responses in Human Endothelial Cells by the Transactivation of the Fibroblast Growth Factor Receptor FGFR-1

Erika Terzuoli et al. Int J Mol Sci. .

Abstract

Elevated levels of bradykinin (BK) and fibroblast growth factor-2 (FGF-2) have been implicated in the pathogenesis of inflammatory and angiogenic disorders. In angiogenesis, both stimuli induce a pro-inflammatory signature in endothelial cells, activating an autocrine/paracrine amplification loop that sustains the neovascularization process. Here we investigated the contribution of the FGF-2 pathway in the BK-mediated human endothelial cell permeability and migration, and the role of the B2 receptor (B2R) of BK in this cross-talk. BK (1 µM) upregulated the FGF-2 expression and promoted the FGF-2 signaling, both in human umbilical vein endothelial cells (HUVEC) and in retinal capillary endothelial cells (HREC) by the activation of Fibroblast growth factor receptor-1 (FGFR-1) and its downstream signaling (fibroblast growth factor receptor substrate: FRSα, extracellular signal⁻regulated kinases1/2: ERK1/2, and signal transducer and activator of transcription 3: STAT3 phosphorylation). FGFR-1 phosphorylation triggered by BK was c-Src mediated and independent from FGF-2 upregulation. Either HUVEC and HREC exposed to BK showed increased permeability, disassembly of adherens and tight-junction, and increased cell migration. B2R blockade by the selective antagonist, fasitibant, significantly inhibited FGF-2/FGFR-1 signaling, and in turn, BK-mediated endothelial cell permeability and migration. Similarly, the FGFR-1 inhibitor, SU5402, and the knock-down of the receptor prevented the BK/B2R inflammatory response in endothelial cells. In conclusion, this work demonstrates the existence of a BK/B2R/FGFR-1/FGF-2 axis in endothelial cells that might be implicated in propagation of angiogenic/inflammatory responses. A B2R blockade, by abolishing the initial BK stimulus, strongly attenuated FGFR-1-driven cell permeability and migration.

Keywords: B2R antagonist; FGFR-1; bradykinin; endothelial cells.


Conflict of interest statement

The authors declare no conflict of interest.

Figures

Figure 1
Figure 1
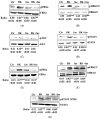
BK/B2R transactivates FGFR-1 and mediates its internalization. (A) HUVEC were treated with BK (1 μM) for 8, 18, and 24 h, and FGF-2 expression was evaluated using western blot analysis. Results were normalized to actin. Quantification was expressed as an arbitrary density unit (ADU). The results presented are representative of three independent experiments (n = 3) with similar results. (B) HUVEC were treated with fasitibant (fas, 1 µM, 30 min), then stimulated with BK (1 μM) for 24 h, and FGF-2 expression was evaluated using western blot analysis. Results were normalized to actin. (C) HUVEC were treated with BK (0.1–1000 nM, 10 min), FGFR-1 was immunoprecipitated (IP), and its activation was investigated by anti-pTYR antibody. Results were normalized to FGFR-1. (D,E) HUVEC were treated with fasitibant (fas, 1 µM, 30 min), then stimulated with 1 μM BK (10 min), FGFR-2 and FGFR-1 were immunoprecipitated (IP), and its activation was investigated by anti-pTYR antibody. Results were normalized to FGFR-2 and FGFR-1, respectively. *** p < 0.001 vs. Ctr; ### p < 0.001 vs. BK treated cells. Ctr (control, 0.1% FBS). (F) Immunofluorescence analysis of FGFR-1 localization in endothelial cells in the control condition (Ctr, 0.1% FBS) and in the presence of BK (1 μM, 10 min) alone or in combination with fasitibant (1 μM). Magnification, 100×, scale bar = 100 μm.
Figure 2
Figure 2
BK/B2R activates FGFR-1 signaling. (A) FRSα, (B) ERK1/2, (C) AKT, and (D) STAT3 phosphorylation were evaluated using western blot analysis in HUVEC treated with fasitibant (fas, 1 μM, 30 min), then stimulated with BK (1 μM) for 15 min. (E) FRSα, (F) ERK1/2, and (G) STAT3 phosphorylation were evaluated using western blot analysis in HREC treated with fasitibant (fas, 1 μM, 30 min), then stimulated with BK (1 μM) for 15 min. Results were normalized to FRSα, ERK1/2, AKT, and STAT3, respectively. The results presented are representative of three independent experiments (n = 3) with similar results. Quantification was expressed as an arbitrary density unit (ADU). ** p < 0.01; *** p < 0.001 vs. Ctr; # p < 0.05; ### p < 0.001 vs. BK treated cells.
Figure 3
Figure 3
BK-mediated ERK1/2-STAT3/FGF-2 signaling activation requires FGFR-1. (A) ERK1/2 and (B) STAT3 phosphorylation were evaluated using western blot analysis in HUVEC treated with SU5402 (1 μM, 30 min), then stimulated with BK (1 μM) for 15 min. Results were normalized to ERK1/2 and STAT3, respectively. (C) FGFR-1 expression evaluated using western blot analysis in HUVEC transfected with two different shRNA for FGFR-1 knock-down (Sh#1 and Sh#2). EV = empty vector. (D,E) Western blot analysis for ERK1/2 and STAT3 phosphorylation in HUVEC transfected with Sh#1 and Sh#2 and stimulated with BK (1 μM) for 15 min. (F) FGF-2 expression was evaluated in HUVEC treated with STAT3 inhibitor (10 μM, 30 min) and then stimulated with BK (1 μM) for 24 h. Actin was used as a loading control. The results presented are representative of three independent experiments (n = 3) with similar results. Quantification was expressed as an arbitrary density unit (ADU). ** p < 0.01; *** p < 0.001 vs. Ctr; ### p < 0.001 vs. BK treated cells.
Figure 4
Figure 4
BK phosphorylates FGFR-1 despite the absence of FGF-2. (A,B) HUVEC were treated with anti-FGF-2 neutralizing antibody (6 μg/mL), then stimulated with FGF-2 (20 ng/mL), as a positive control or BK (1 μM) for 10 min. FGFR-1 was immunoprecipitated (IP), and its activation was investigated by anti-pTYR antibody. Results were normalized to FGFR-1. *** p < 0.001 vs. Ctr (control, 0.1% FBS). (C) Murine EC was isolated from FGF-2−/− mice were stimulated with BK (1 μM) for 10 min. FGFR-1 was immunoprecipitated (IP), and its activation was investigated by an anti-pTYR antibody. Results were normalized to FGFR-1. The results presented are representative of three independent experiments (n = 3) with similar results. *** p < 0.001 vs. Ctr (control, 0.1% FBS).
Figure 5
Figure 5
c-Src mediates FGFR-1 phosphorylation induced by BK/B2R system. (A) HUVEC and (B) HREC were treated with fasitibant (fas, 1 μM), then stimulated with BK (1 μM) for 15 min, and c-SRC phosphorylation was measured using western blot analysis. Results were normalized to SRC. FRSα phosphorylation was measured using western blot analysis in (C) HUVEC and (D) HREC treated with PP1 (500 nM), or SU566 (10 μM) (Src inhibitors) for 30 min, and then stimulated with BK (1 μM) for 15 min. Results were normalized to FRSα. (E) HUVEC were treated with PP1 (500 nM), or SU566 (10 μM) as above, and then stimulated with BK (1 μM) for 10 min. FGFR-1 was immunoprecipitated (IP), and its activation was investigated by an anti-pTYR antibody. Results were normalized to FGFR-1. The gels shown are representative of three experiments obtained with similar results. ** p < 0.01, *** p < 0.001 vs. Ctr (control, 0.1% FBS). ## p < 0.01, ### p < 0.001 vs. BK treated cells.
Figure 5
Figure 5
c-Src mediates FGFR-1 phosphorylation induced by BK/B2R system. (A) HUVEC and (B) HREC were treated with fasitibant (fas, 1 μM), then stimulated with BK (1 μM) for 15 min, and c-SRC phosphorylation was measured using western blot analysis. Results were normalized to SRC. FRSα phosphorylation was measured using western blot analysis in (C) HUVEC and (D) HREC treated with PP1 (500 nM), or SU566 (10 μM) (Src inhibitors) for 30 min, and then stimulated with BK (1 μM) for 15 min. Results were normalized to FRSα. (E) HUVEC were treated with PP1 (500 nM), or SU566 (10 μM) as above, and then stimulated with BK (1 μM) for 10 min. FGFR-1 was immunoprecipitated (IP), and its activation was investigated by an anti-pTYR antibody. Results were normalized to FGFR-1. The gels shown are representative of three experiments obtained with similar results. ** p < 0.01, *** p < 0.001 vs. Ctr (control, 0.1% FBS). ## p < 0.01, ### p < 0.001 vs. BK treated cells.
Figure 6
Figure 6
BK/B2R system promotes changes of permeability, endothelial junctions and migration via FGFR-1. (A) Permeability in HUVEC and (B) HREC monolayers were detected as a passage of fluorescence-conjugated FITC-Dextran from upper to lower compartments (numbers represent mean 6 ± SEM of three experiments run in triplicate; n = 3). Fasitibant (1 µM) and SU5402 (1 µM) prevent the enhanced permeability, *** p < 0.001 vs. Ctr cells, ## p < 0.01 ### p < 0.001 vs. BK-treated cells. (C,D) Confocal analysis of VEC and ZO-1 expression (magnification 63×) evaluated by immunofluorescence analysis in HUVEC treated with 0.1% FBS in panel a, BK (1 µM) in panel b, and SU5402 + BK in panel c. (E,F) Confocal analysis of VEC and (G,H) ZO-1 expression (magnification 63×) evaluated by immunofluorescence analysis in HREC treated with 0.1% FBS in panel a, BK (1 µM) in panel b, BK + fasitibant (10 µM) in panel c, and SU5402 + BK in panel d. Bar = 20 µm. VEC and ZO-1 were stained in green and DAPI (blue) was used to counterstain the nuclei. Boxed areas are shown in detail in the inset.
Figure 6
Figure 6
BK/B2R system promotes changes of permeability, endothelial junctions and migration via FGFR-1. (A) Permeability in HUVEC and (B) HREC monolayers were detected as a passage of fluorescence-conjugated FITC-Dextran from upper to lower compartments (numbers represent mean 6 ± SEM of three experiments run in triplicate; n = 3). Fasitibant (1 µM) and SU5402 (1 µM) prevent the enhanced permeability, *** p < 0.001 vs. Ctr cells, ## p < 0.01 ### p < 0.001 vs. BK-treated cells. (C,D) Confocal analysis of VEC and ZO-1 expression (magnification 63×) evaluated by immunofluorescence analysis in HUVEC treated with 0.1% FBS in panel a, BK (1 µM) in panel b, and SU5402 + BK in panel c. (E,F) Confocal analysis of VEC and (G,H) ZO-1 expression (magnification 63×) evaluated by immunofluorescence analysis in HREC treated with 0.1% FBS in panel a, BK (1 µM) in panel b, BK + fasitibant (10 µM) in panel c, and SU5402 + BK in panel d. Bar = 20 µm. VEC and ZO-1 were stained in green and DAPI (blue) was used to counterstain the nuclei. Boxed areas are shown in detail in the inset.
Figure 7
Figure 7
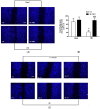
(A,C) Scratch wound healing assay on HUVEC treated with: in (A), 0.1% FBS (Basal, Ctr), BK (1 µM) (BK, Ctr), SU5402 (1 µM), SU5402 + BK; in (C), 0.1% FBS (EV), BK (1 μM) (BK, EV), FGFR-1 knock down (0.1% FBS, Sh#1 and Sh#2), FGFR-1 knock-down + BK (BK, Sh#1 and Sh#2). (B,D) Quantification of cell migration was reported as the area of migrated cells. Figure B is the quantification of figure A and figure D is the quantification of figure C. ** p < 0.01 vs. Ctr cells; ### p < 0.001 vs. BK-treated cells. Numbers represent mean 3 ± SEM of three experiments run in triplicate. Bar = 100 µm.
Figure 7
Figure 7
(A,C) Scratch wound healing assay on HUVEC treated with: in (A), 0.1% FBS (Basal, Ctr), BK (1 µM) (BK, Ctr), SU5402 (1 µM), SU5402 + BK; in (C), 0.1% FBS (EV), BK (1 μM) (BK, EV), FGFR-1 knock down (0.1% FBS, Sh#1 and Sh#2), FGFR-1 knock-down + BK (BK, Sh#1 and Sh#2). (B,D) Quantification of cell migration was reported as the area of migrated cells. Figure B is the quantification of figure A and figure D is the quantification of figure C. ** p < 0.01 vs. Ctr cells; ### p < 0.001 vs. BK-treated cells. Numbers represent mean 3 ± SEM of three experiments run in triplicate. Bar = 100 µm.
Figure 8
Figure 8
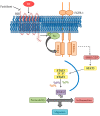
Schematic model of BK/B2R-FGF-2/FGFR-1 interaction in endothelial cells. The figure depicts the interaction between BK and FGF-2 signaling in endothelial cells. Dotted arrows indicate complex signaling pathways involving several second messengers.

Similar articles

Cited by

References

    1. Carmeliet P., Jain R.K. Angiogenesis in cancer and other diseases. Nature. 2000;407:249–257. doi: 10.1038/35025220. - DOI - PubMed
    1. Cervenak L., Morbidelli L., Donati D., Donnini S., Kambayashi T., Wilson J.L., Axelson H., Castaños-Velez E., Ljunggren H.G., Malefyt R.D., et al. Abolished angiogenicity and tumorigenicity of burkitt lymphoma by interleukin-10. Blood. 2000;96:2568–2573. - PubMed
    1. Presta M., Andrés G., Leali D., Dell’Era P., Ronca R. Inflammatory cells and chemokines sustain fgf2-induced angiogenesis. Eur. Cytokine Netw. 2009;20:39–50. - PubMed
    1. Murakami M., Elfenbein A., Simons M. Non-canonical fibroblast growth factor signalling in angiogenesis. Cardiovasc. Res. 2008;78:223–231. doi: 10.1093/cvr/cvm086. - DOI - PubMed
    1. Tiefenbacher C.P., Chilian W.M. Basic fibroblast growth factor and heparin influence coronary arteriolar tone by causing endothelium-dependent dilation. Cardiovasc. Res. 1997;34:411–417. doi: 10.1016/S0008-6363(97)00029-1. - DOI - PubMed

MeSH terms

LinkOut - more resources

  NODES
INTERN 4
twitter 2