Dynamics and functional interplay of histone lysine butyrylation, crotonylation, and acetylation in rice under starvation and submergence
- PMID: 30253806
- PMCID: PMC6154804
- DOI: 10.1186/s13059-018-1533-y
Dynamics and functional interplay of histone lysine butyrylation, crotonylation, and acetylation in rice under starvation and submergence
Abstract
Background: Histone lysine acylations by short-chain fatty acids are distinct from the widely studied histone lysine acetylation in chromatin, although both modifications are regulated by primary metabolism in mammalian cells. It remains unknown whether and how histone acylation and acetylation interact to regulate gene expression in plants that have distinct regulatory pathways of primary metabolism.
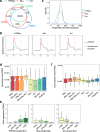
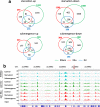
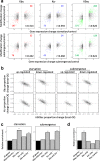
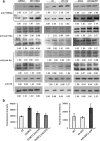
Results: We identify 4 lysine butyrylation (Kbu) sites (H3K14, H4K12, H2BK42, and H2BK134) and 45 crotonylation (Kcr) sites on rice histones by mass spectrometry. Comparative analysis of genome-wide Kbu and Kcr and H3K9ac in combination with RNA sequencing reveals 25,306 genes marked by Kbu and Kcr in rice and more than 95% of H3K9ac-marked genes are marked by both. Kbu and Kcr are enriched at the 5' region of expressed genes. In rice under starvation and submergence, Kbu and Kcr appear to be less dynamic and display changes in different sets of genes compared to H3K9ac. Furthermore, Kbu seems to preferentially poise gene activation by external stresses, rather than internal circadian rhythm which has been shown to be tightly associated with H3K9ac. In addition, we show that rice sirtuin histone deacetylase (SRT2) is involved in the removal of Kcr.
Conclusion: Kbu, Kcr, and H3K9ac redundantly mark a large number of active genes but display different responses to external and internal signals. Thus, the proportion of rice histone lysine acetylation and acylation is dynamically regulated by environmental and metabolic cues, which may represent an epigenetic mechanism to fine-tune gene expression for plant adaptation.
Conflict of interest statement
Ethics approval and consent to participate
Not applicable.
Consent for publication
Not applicable.
Competing interests
The authors declare that they have no competing interests.
Publisher’s Note
Springer Nature remains neutral with regard to jurisdictional claims in published maps and institutional affiliations.
Figures


Similar articles
-
Global Involvement of Lysine Crotonylation in Protein Modification and Transcription Regulation in Rice.Mol Cell Proteomics. 2018 Oct;17(10):1922-1936. doi: 10.1074/mcp.RA118.000640. Epub 2018 Jul 18. Mol Cell Proteomics. 2018. PMID: 30021883 Free PMC article.
-
Genome-wide Profiling of Histone Lysine Butyrylation Reveals its Role in the Positive Regulation of Gene Transcription in Rice.Rice (N Y). 2019 Nov 27;12(1):86. doi: 10.1186/s12284-019-0342-6. Rice (N Y). 2019. PMID: 31776817 Free PMC article.
-
Dynamic profiling and functional interpretation of histone lysine crotonylation and lactylation during neural development.Development. 2022 Jul 15;149(14):dev200049. doi: 10.1242/dev.200049. Epub 2022 Jul 21. Development. 2022. PMID: 35735108
-
Lysine crotonylation: A challenging new player in the epigenetic regulation of plants.J Proteomics. 2022 Mar 20;255:104488. doi: 10.1016/j.jprot.2022.104488. Epub 2022 Jan 20. J Proteomics. 2022. PMID: 35065287 Review.
-
Metabolic regulation of gene expression through histone acylations.Nat Rev Mol Cell Biol. 2017 Feb;18(2):90-101. doi: 10.1038/nrm.2016.140. Epub 2016 Dec 7. Nat Rev Mol Cell Biol. 2017. PMID: 27924077 Free PMC article. Review.
Cited by
-
Proteome-Wide Analyses Reveal the Diverse Functions of Lysine 2-Hydroxyisobutyrylation in Oryza sativa.Rice (N Y). 2020 Jun 5;13(1):34. doi: 10.1186/s12284-020-00389-1. Rice (N Y). 2020. PMID: 32572646 Free PMC article.
-
Comprehensive Profiling of Paper Mulberry (Broussonetia papyrifera) Crotonylome Reveals the Significance of Lysine Crotonylation in Young Leaves.Int J Mol Sci. 2022 Jan 21;23(3):1173. doi: 10.3390/ijms23031173. Int J Mol Sci. 2022. PMID: 35163093 Free PMC article.
-
Genetic and molecular factors in determining grain number per panicle of rice.Front Plant Sci. 2022 Aug 4;13:964246. doi: 10.3389/fpls.2022.964246. eCollection 2022. Front Plant Sci. 2022. PMID: 35991390 Free PMC article. Review.
-
Histone crotonylation regulates neural stem cell fate decisions by activating bivalent promoters.EMBO Rep. 2021 Oct 5;22(10):e52023. doi: 10.15252/embr.202052023. Epub 2021 Aug 9. EMBO Rep. 2021. PMID: 34369651 Free PMC article.
-
P300 regulates histone crotonylation and preimplantation embryo development.Nat Commun. 2024 Jul 30;15(1):6418. doi: 10.1038/s41467-024-50731-0. Nat Commun. 2024. PMID: 39080296 Free PMC article.
References
Publication types
MeSH terms
Substances
Grants and funding
LinkOut - more resources
Full Text Sources
Other Literature Sources

