Suppressing glucose metabolism with epigallocatechin-3-gallate (EGCG) reduces breast cancer cell growth in preclinical models
- PMID: 30310905
- PMCID: PMC7480214
- DOI: 10.1039/c8fo01397g
Suppressing glucose metabolism with epigallocatechin-3-gallate (EGCG) reduces breast cancer cell growth in preclinical models
Abstract
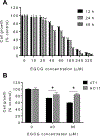
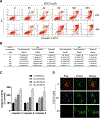
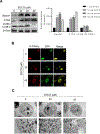
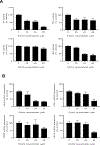
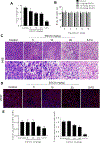
Numerous studies propose that epigallocatechin-3-gallate (EGCG), an abundant polyphenol in green tea, has anti-cancer properties. However, its mechanism of action in breast cancer remains unclear. This study investigated the capacity of EGCG to suppress breast cancer cell growth in vitro and in vivo, characterizing the underlying mechanisms, focusing on the effect of EGCG on glucose metabolism. EGCG reduced breast cancer 4T1 cell growth in a concentration- (10-320 μM) and time- (12-48 h) dependent manner. EGCG induced breast cancer apoptotic cell death at 24 h, as evidenced by annexin V/PI, caspase 3, caspase 8 and caspase 9 activation. Furthermore, EGCG affected the expression of 16 apoptosis-related genes, and promoted mitochondrial depolarization. EGCG induced autophagy concentration-dependently in 4T1 cells by modulating the levels of the autophagy-related proteins Beclin1, ATG5 and LC3B. Moreover, EGCG affected glucose, lactate and ATP levels. Mechanistically, EGCG significantly inhibited the activities and mRNA levels of the glycolytic enzymes hexokinase (HK), phosphofructokinase (PFK), and lactic dehydrogenase (LDH), and to a lesser extent the activity of pyruvate kinase (PK). In addition, EGCG decreased the expression of hypoxia-inducible factor 1α (HIF1α) and glucose transporter 1 (GLUT1), critical players in regulating glycolysis. In vivo, EGCG reduced breast tumor weight in a dose-dependent manner, reduced glucose and lactic acid levels and reduced the expression of the vascular endothelial growth factor (VEGF). In conclusion, EGCG exerts an anti-tumor effect through the inhibition of key enzymes that participate in the glycolytic pathway and the suppression of glucose metabolism.
Conflict of interest statement
Conflicts of interest
There are no conflicts to declare.
Figures


Similar articles
-
Epigallocatechin gallate sensitizes cisplatin-resistant oral cancer CAR cell apoptosis and autophagy through stimulating AKT/STAT3 pathway and suppressing multidrug resistance 1 signaling.Environ Toxicol. 2017 Mar;32(3):845-855. doi: 10.1002/tox.22284. Epub 2016 May 20. Environ Toxicol. 2017. PMID: 27200496
-
Epigallocatechin gallate (EGCG) suppresses growth and tumorigenicity in breast cancer cells by downregulation of miR-25.Bioengineered. 2019 Dec;10(1):374-382. doi: 10.1080/21655979.2019.1657327. Bioengineered. 2019. PMID: 31431131 Free PMC article.
-
Molecular mechanism of epigallocatechin-3-gallate in human esophageal squamous cell carcinoma in vitro and in vivo.Oncol Rep. 2015 Jan;33(1):297-303. doi: 10.3892/or.2014.3555. Epub 2014 Oct 20. Oncol Rep. 2015. PMID: 25333353
-
Mechanisms of cancer prevention by green and black tea polyphenols.Anticancer Agents Med Chem. 2006 Sep;6(5):389-406. doi: 10.2174/187152006778226468. Anticancer Agents Med Chem. 2006. PMID: 17017850 Review.
-
The Role of EGCG in Breast Cancer Prevention and Therapy.Mini Rev Med Chem. 2021;21(7):883-898. doi: 10.2174/1389557520999201211194445. Mini Rev Med Chem. 2021. PMID: 33319659 Review.
Cited by
-
The role of plant-derived natural substances as immunomodulatory agents in carcinogenesis.J Cancer Res Clin Oncol. 2020 Dec;146(12):3137-3154. doi: 10.1007/s00432-020-03424-2. Epub 2020 Oct 15. J Cancer Res Clin Oncol. 2020. PMID: 33063131 Review.
-
Regulation of gene expression by modulating microRNAs through Epigallocatechin-3-gallate in cancer.Mol Biol Rep. 2024 Jan 28;51(1):230. doi: 10.1007/s11033-023-09145-2. Mol Biol Rep. 2024. PMID: 38281210 Review.
-
Recent updates on anticancer mechanisms of polyphenols.Front Cell Dev Biol. 2022 Sep 29;10:1005910. doi: 10.3389/fcell.2022.1005910. eCollection 2022. Front Cell Dev Biol. 2022. PMID: 36247004 Free PMC article. Review.
-
The Potential Role of Epigallocatechin-3-Gallate (EGCG) in Breast Cancer Treatment.Int J Mol Sci. 2023 Jun 27;24(13):10737. doi: 10.3390/ijms241310737. Int J Mol Sci. 2023. PMID: 37445915 Free PMC article. Review.
-
Strategies to Interfere with Tumor Metabolism through the Interplay of Innate and Adaptive Immunity.Cells. 2019 May 11;8(5):445. doi: 10.3390/cells8050445. Cells. 2019. PMID: 31083487 Free PMC article. Review.
References
-
- Siegel RL, Miller KD and Jemal A, Cancer Statistics, 2017, CA: a cancer journal for clinicians, 2017, 67, 7–30. - PubMed
-
- Forouzanfar MH, Foreman KJ, Delossantos AM, Lozano R, Lopez AD, Murray CJ and Naghavi M, Breast and cervical cancer in 187 countries between 1980 and 2010: a systematic analysis, Lancet, 2011, 378, 1461–1484. - PubMed
-
- Shin HR, Joubert C, Boniol M, Hery C, Ahn SH, Won YJ, Nishino Y, Sobue T, Chen CJ, You SL, Mirasol-Lumague MR, Law SC, Mang O, Xiang YB, Chia KS, Rattanamongkolgul S, Chen JG, Curado MP and Autier P, Recent trends and patterns in breast cancer incidence among Eastern and Southeastern Asian women, Cancer Causes Control, 2010, 21, 1777–1785. - PubMed
MeSH terms
Substances
Grants and funding
LinkOut - more resources
Full Text Sources
Medical
Research Materials
Miscellaneous

