Comparative Study
. 2018 Nov 21;145(22):dev168617.
doi: 10.1242/dev.168617.

Comparative genomic analysis of embryonic, lineage-converted and stem cell-derived motor neurons

Affiliations
Comparative Study

Comparative genomic analysis of embryonic, lineage-converted and stem cell-derived motor neurons

Justin K Ichida et al. Development. .

Abstract

Advances in stem cell science allow the production of different cell types in vitro either through the recapitulation of developmental processes, often termed 'directed differentiation', or the forced expression of lineage-specific transcription factors. Although cells produced by both approaches are increasingly used in translational applications, their quantitative similarity to their primary counterparts remains largely unresolved. To investigate the similarity between in vitro-derived and primary cell types, we harvested and purified mouse spinal motor neurons and compared them with motor neurons produced by transcription factor-mediated lineage conversion of fibroblasts or directed differentiation of pluripotent stem cells. To enable unbiased analysis of these motor neuron types and their cells of origin, we then subjected them to whole transcriptome and DNA methylome analysis by RNA sequencing (RNA-seq) and reduced representation bisulfite sequencing (RRBS). Despite major differences in methodology, lineage conversion and directed differentiation both produce cells that closely approximate the primary motor neuron state. However, we identify differences in Fas signaling, the Hox code and synaptic gene expression between lineage-converted and directed differentiation motor neurons that affect their utility in translational studies.

Keywords: Directed differentiation; Embryonic stem cells; Lineage conversion; Motor neuron; Reprogramming; iPS cell.


Conflict of interest statement

Competing interestsJ.K.I. is a co-founder of AcuraStem. K.E. is a co-founder of Q-State Biosciences and QurAlis.

Figures

Fig. 1.
Fig. 1.
Experimental design for the in vitro and in vivo motor neuron comparison. (A) Hb9::GFP transgenic embryos (E13.5) were used to isolate embryonic (EMB) MNs and MEFs. The MEFs were then lineage converted (LC) to iPSCs and iMNs. The iPSCs and ESCs were used for directed differentiation (DD) towards iPSC MNs and ESC MNs. Only iMNs were generated in the presence of primary mouse glia. All MN types were purified by fluorescence-activated cell sorting (FACS) using the Hb9::GFP reporter. Collected cells were used for transcriptional profiling by RNA-seq and DNA methylation analysis by RRBS. Two biological replicates were analyzed per sample type. (B) MEFs were cultured in fibroblast medium [DMEM+10% fetal bovine serum (FBS) (MEF2-4)] or the neural conversion medium [N3 (MEF1)] for either 2 days (MEF4) or 15 days (MEF1-3). MEF3 samples were passaged once during culture to identify changes that occur due to passaging. (C) Cluster dendrogram of transcriptomes. Two biological replicates were analyzed per sample type.
Fig. 2.
Fig. 2.
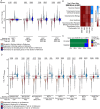
Transcriptional comparison of in vitro- and in vivo-derived Hb9::GFP+ motor neurons. (A-I) Volcano plots of genes upregulated or downregulated in the indicated pairwise comparisons. Only genes with an average read count of three or greater across all samples are included. The number of significantly upregulated or downregulated genes is shown for each comparison. Genes with a log2-fold-change less than −1 or greater than 1, and FDR<0.05 (DESeq2, default settings) are shown in color. Two biological replicates were analyzed per cell type.
Fig. 3.
Fig. 3.
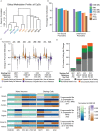
Transcriptional characterization. (A) Violin plots showing the success of reprogramming. Pink- and light-blue colored violins show fold change of genes detected as differentially expressed (DESeq2) between the reference (_target) cell type and the starting cell type. Only differentially expressed genes with starting cell levels of twofold or greater or 0.5-fold or less than in the reference cell were analyzed. The total number of genes that meet the specified criteria and are up- or downregulated between the starting cell and reference cell are indicated at the top of the plot. We define successful regulation of gene expression as upregulated to at least 50% of the level or downregulated to at least half the level expressed by the reference cell type. The percentage of successfully regulated genes is shown for each pair. The ‘test’ cell is the cell sample that underwent lineage conversion or directed differentiation. Two biological replicates were analyzed per cell type. (B) Heatmap showing enrichment score of the top five functional pathways determined by Gene Ontology enrichment analysis. Pathways enriched among genes differentially expressed in embryonic MN relative to MEFs were selected and the normalized enrichment score (k/K) of these pathways in iMNs, ESC MNs and iPSC MNs is shown. The enrichment of these pathways among genes differentially regulated in iPSCs is shown as a negative control. Two biological replicates were analyzed per cell type. (C) Performance of in vitro MNs in the regulation of gene sets enriched in embryonic MNs. Gene sets enriched or depleted among genes significantly regulated in embryonic MNs relative to MEFs were evaluated for regulation in in vitro MNs compared with MEFs. Gene sets also enriched in all in vitro MNs are shown in green. Gene sets regulated in embryonic MNs but only appropriately regulated in iMNs or IPSC and ESC MNs are shown in blue and orange, respectively. Two biological replicates were analyzed per cell type. (D) Violin plots of gene expression regulation in other in vitro-derived cell types compared with natural counterparts. Differentially regulated genes were identified by comparing the gene expression in the reference cell type relative to the starting cell. The performance of these genes in the test cell type is shown as described in more detail in A. The ‘test’ cell is the cell sample that underwent lineage conversion or directed differentiation. Two (neurons, five-factor neural stem cells), three (cardiomyocytes, β cells, neural stem cells, mouse iPSCs, human iPSCs) or four (hepatocytes) biological replicates were analyzed per sample type.
Fig. 4.
Fig. 4.
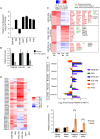
Integrative epigenetic and transcriptional characterization. (A) Hierarchical clustering of sample methylation using individual CpGs. The distance between sample pairs was computed as 1 minus the correlation between sample pairs, using all CpGs covered in that pair of samples by RRBS. Two biological replicates were analyzed per cell type. (B) Percentage of promoters that are covered by RRBS with Isl1- or Lhx3-binding sites within 10 kb of the transcription start site that are demethylated (methylation≤0.2). Values represent the mean of two biological replicates. (C) Resolution of differentially methylated promoters. Differentially methylated promoters (PMs) are defined as either hypermethylated (HyperMe) (light brown, >10% methylation difference between the starting cell and the reference cell) or hypomethylated (HypoMe) (light purple, ≤10% methylation difference between the starting cell and the reference cell). The resolutions of these hypermethylated and hypomethylated promoters are shown in dark brown and dark purple, respectively, as a comparison between the test and reference methylation levels. The percentage of promoters that have successfully resolved methylation to a level within 10% of the reference level is shown. (D) Expression classification of genes that did not successfully resolve methylation to a level within 10% of the reference level in C. Low expression: genes with approximately three reads or fewer in both starting and reference samples. Unaltered expression: not differentially expressed between starting and reference samples. Successfully altered: differentially expressed between starting and reference levels, and expression level in the test sample is <2-fold or <50% of the level in the reference sample for genes that are higher or lower in the starting sample than the reference sample, respectively. Unsuccessfully altered: differentially expressed between starting and reference levels, and expression level in the test sample is not <2-fold or <50% of the level in the reference sample for genes that are higher or lower in the starting sample than the reference sample, respectively. Me, DNA methylation. (E) Expression (top row) and methylation (bottom row) heatmaps of example genes that are classified as unsuccessful in methylation and expression change in D. Two biological replicates were analyzed per cell type for all experiments.
Fig. 5.
Fig. 5.
Differences in maturation state amongst in vitro MNs. (A) Principle component analysis of all RNA-seq samples used in this study. CM, conditioned medium. (B) Dendrogram and heat map depicting unsupervised hierarchical clustering of motor neuron samples based upon genes previously identified (Ho et al., 2016) to be associated with MN maturation and aging.
Fig. 6.
Fig. 6.
Functional and etiological analysis of transcriptional differences between in vitro motor neuron types. (A) Fas gene expression relative to EMB MN, from the RNA-sequencing data. Data are mean±s.d., two biological replicates were analyzed per cell type. (B) Survival of MNs with or without the addition of 10 μg/ml agonistic anti-Fas antibody for 4 days. Anti-Fas antibody was added fresh to the cultures at days 0 and 2 of survival analysis. Data are mean±s.d., n=2 (EMB MN), n=4 (ESC MN) and n=3 (iMN). (C) Differential gene expression analysis between MNs. Expression is shown as log2 fold change relative to MEF1. Genes within each MN category are color coded according to their functional roles in MN biology. Two biological replicates were analyzed per sample type. (D) Full Hox code gene expression of MNs, MEF1 and ESCs relative to iPSCs. Two biological replicates were analyzed per cell type. (E) Gene expression relative to MEF1 derived from RNA-seq data and positional information of selected Hox genes. Data are mean±s.d. Two biological replicates were analyzed per cell type. (F) qRT-PCR analyses showing relative expression of Hoxc6 and Hoxc9 in mixed MEFs (derived from whole E13.5 embryos) or posterior MEFs (derived from posterior half of E13.5 embryos) or iMNs derived from these MEF populations. Each MEF group was derived from five individual embryos per replicate (a mean of three biological replicates±s.e.m.). Two-tailed t-test, unpaired. *P<0.05, **P<0.01.

Similar articles

Cited by

References

    1. Abernathy D. G., Kim W. K., McCoy M. J., Lake A. M., Ouwenga R., Lee S. W., Xing X., Li D., Lee H. J., Heuckeroth R. O. et al. (2017). MicroRNAs induce a permissive chromatin environment that enables neuronal subtype-specific reprogramming of adult human fibroblasts. Cell Stem Cell 21, 332-348.e339. 10.1016/j.stem.2017.08.002 - DOI - PMC - PubMed
    1. Bindea G., Mlecnik B., Hackl H., Charoentong P., Tosolini M., Kirilovsky A., Fridman W.-H., Pagès F., Trajanoski Z. and Galon J. (2009). ClueGO: a Cytoscape plug-in to decipher functionally grouped gene ontology and pathway annotation networks. Bioinformatics 25, 1091-1093. 10.1093/bioinformatics/btp101 - DOI - PMC - PubMed
    1. Blanchard J. W., Eade K. T., Szűcs A., Lo Sardo V., Tsunemoto R. K., Williams D., Sanna P. P. and Baldwin K. K. (2015). Selective conversion of fibroblasts into peripheral sensory neurons. Nat. Neurosci. 18, 25-35. 10.1038/nn.3887 - DOI - PMC - PubMed
    1. Bock C., Kiskinis E., Verstappen G., Gu H., Boulting G., Smith Z. D., Ziller M., Croft G. F., Amoroso M. W., Oakley D. H. et al. (2011). Reference Maps of human ES and iPS cell variation enable high-throughput characterization of pluripotent cell lines. Cell 144, 439-452. 10.1016/j.cell.2010.12.032 - DOI - PMC - PubMed
    1. Bolger A. M., Lohse M. and Usadel B. (2014). Trimmomatic: a flexible trimmer for Illumina sequence data. Bioinformatics 30, 2114-2120. 10.1093/bioinformatics/btu170 - DOI - PMC - PubMed

Publication types

  NODES
twitter 2