Characterization of immune cell subtypes in three commonly used mouse strains reveals gender and strain-specific variations
- PMID: 30353130
- PMCID: PMC6524955
- DOI: 10.1038/s41374-018-0137-1
Characterization of immune cell subtypes in three commonly used mouse strains reveals gender and strain-specific variations
Abstract
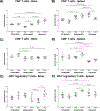
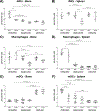
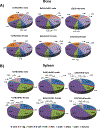
The lack of consensus on bone marrow (BM) and splenic immune cell profiles in preclinical mouse strains complicates comparative analysis across different studies. Although studies have documented relative distribution of immune cells from peripheral blood in mice, similar studies for BM and spleen from naïve mice are lacking. In an effort to establish strain- and gender-specific benchmarks for distribution of various immune cell subtypes in these organs, we performed immunophenotypic analysis of BM cells and splenocytes from both genders of three commonly used murine strains (C57BL/6NCr, 129/SvHsd, and BALB/cAnNCr). Total neutrophils and splenic macrophages were significantly higher in C57BL/6NCr, whereas total B cells were lower. Within C57BL/6NCr female mice, BM B cells were elevated with respect to the males whereas splenic mDCs and splenic neutrophils were reduced. Within BALB/cAnNCr male mice, BM CD4+ Tregs were elevated with respect to the other strains. Furthermore, in male BALB/cAnNCr mice, NK cells were elevated with respect to the other strains in both BM and spleen. Splenic CD4+ Tregs and splenic CD8+ T cells were reduced in male BALB/c mice in comparison to female mice. Bone marrow CD4+ T cells and mDCs were significantly increased in 129/SvHsd whereas splenic CD8+ T cells were reduced. In general, males exhibited higher immature myeloid cells, macrophages, and NK cells. To our knowledge, this study provides a first attempt to systematically establish organ-specific benchmarks on immune cells in studies involving these mouse strains.
Figures


Similar articles
-
Regional oral tolerance in transgenic 2C mice.Surgery. 2005 Aug;138(2):141-9. doi: 10.1016/j.surg.2005.05.010. Surgery. 2005. PMID: 16153420
-
Effect of age on the capacity of the bone marrow and the spleen cells to generate B lymphocytes.J Immunol. 1986 Oct 15;137(8):2411-7. J Immunol. 1986. PMID: 3531331
-
The murine NK2.1 antigen: a 130 kD glycoprotein dimer expressed by a natural killer cell subset of the spleen, thymus and lymph nodes.Mol Immunol. 1993 Sep;30(13):1185-93. doi: 10.1016/0161-5890(93)90137-z. Mol Immunol. 1993. PMID: 8413323
-
Phorbol ester effects on splenic lymphocyte composition and cytotoxic T cell activities of SSIN mice: a strain deficient in CD8+ T cells.Carcinogenesis. 1996 Dec;17(12):2617-24. doi: 10.1093/carcin/17.12.2617. Carcinogenesis. 1996. PMID: 9006097
-
Susceptibility to Theiler's murine encephalomyelitis virus-induced demyelinating disease in BALB/cAnNCr mice is related to absence of a CD4+ T-cell subset.Mult Scler. 2002 Dec;8(6):469-74. doi: 10.1191/1352458502ms850oa. Mult Scler. 2002. PMID: 12474985
Cited by
-
Thymus Reconstitution in Young and Aged Mice Is Facilitated by In Vitro-Generated Progenitor T Cells.Front Immunol. 2022 Jul 8;13:926773. doi: 10.3389/fimmu.2022.926773. eCollection 2022. Front Immunol. 2022. PMID: 35874726 Free PMC article.
-
Rejuvenation of the aged brain immune cell landscape in mice through p16-positive senescent cell clearance.Nat Commun. 2022 Sep 27;13(1):5671. doi: 10.1038/s41467-022-33226-8. Nat Commun. 2022. PMID: 36167854 Free PMC article.
-
Spleen regeneration after subcutaneous heterotopic autotransplantation in a mouse model.Biol Res. 2023 Mar 29;56(1):15. doi: 10.1186/s40659-023-00427-4. Biol Res. 2023. PMID: 36991509 Free PMC article.
-
Immunophenotyping: Analytical approaches and role in preclinical development of nanomedicines.Adv Drug Deliv Rev. 2022 Jun;185:114281. doi: 10.1016/j.addr.2022.114281. Epub 2022 Apr 9. Adv Drug Deliv Rev. 2022. PMID: 35405297 Free PMC article. Review.
-
O-Polysaccharide Plays a Major Role on the Virulence and Immunostimulatory Potential of Aggregatibacter actinomycetemcomitans During Periodontal Infection.Front Immunol. 2020 Oct 30;11:591240. doi: 10.3389/fimmu.2020.591240. eCollection 2020. Front Immunol. 2020. PMID: 33193431 Free PMC article.
References
-
- Doulatov S, Notta F, Laurenti E, et al. Hematopoiesis: a human perspective. Cell Stem Cell 2012;10(2):120–136. - PubMed
-
- Plas DR, Rathmell JC, Thompson CB. Homeostatic control of lymphocyte survival: potential origins and implications. Nat Immunol 2002;3(6):515–521. - PubMed
-
- Rathmell JC, Thompson CB. Pathways of apoptosis in lymphocyte development, homeostasis, and disease. Cell 2002;109 Suppl:S97–107. - PubMed
Publication types
MeSH terms
Grants and funding
LinkOut - more resources
Full Text Sources
Research Materials

