. 2019 Feb;8(2):643-655.
doi: 10.1002/cam4.1974. Epub 2019 Jan 25.

Internal enhancement of DNA damage by a novel bispecific antibody-drug conjugate-like therapeutics via blockage of mTOR and PD-L1 signal pathways in pancreatic cancer

Affiliations

Internal enhancement of DNA damage by a novel bispecific antibody-drug conjugate-like therapeutics via blockage of mTOR and PD-L1 signal pathways in pancreatic cancer

Rui Cao et al. Cancer Med. 2019 Feb.

Abstract

Pancreatic ductal adenocarcinoma (PDAC) is a refractory malignant tumor with poor prognosis, limited chemotherapeutic efficacy, and only about 5% of 5-year survival rate. We generated a dual-_targeting ligand-based lidamycin (DTLL) to investigate its efficacy against pancreatic cancer after preparing its precursor, DTLP. DTLP was shown specifically binding to EGFR and HER2 on cell surface, followed by endocytosis into cytoplasm of pancreatic cancer cells. DTLL significantly promoted apoptosis and cell cycle arrest at G2/M stages and inhibited cell proliferation. Pancreatic tumors of either MIA-paca-2 cell line-derived (CDX) or patient-derived xenograft (PDX) mouse models were significantly regressed in response to DTLL. It suggested that DTLL might be a highly potent bispecific antibody-drug conjugate (ADC)-like agent for pancreatic cancer therapy. LDM is known to function as an antitumor cytotoxic agent by its induction of DNA damage in cancer cells, therefore, DTLL, as its derivative, also showed similar cytotoxicity. However, we found that DTLL might reverse the AKT/mTOR feedback activation induced by LDM at the first time. The results from both in vitro and in vivo experiments suggested that DTLL enhanced DNA damage via EGFR/HER2-dependent blockage of PI3K/AKT/mTOR and PD-L1 signaling pathways in cancer cells, leading to the inhibition of cell proliferation and immunosurveillance escape from pancreatic tumor. Our studies on DTLL functional characterization revealed its novel mechanisms on internal enhancement of DNA damage and implied that DTLL might provide a promising _targeted therapeutic strategy for pancreatic cancer.

Keywords: ADC-like therapeutic agent; EGFR; HER2; bispecificity; pancreatic ductal adenocarcinoma.


Figures

Figure 1
Figure 1
Flowchart for the preparation of DTLP and DTLL
Figure 2
Figure 2
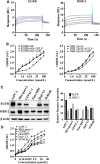
DTLP showed bispecific binding activities to EGFR/HER‐2 receptors in pancreatic carcinoma cells. A, Biacore was used to determine the affinity of the fusion protein DTLP for EGFR and HER2. After coupling EGFR (HER‐2) to a C5 chip, DTLP solution was injected at doses of 0.29, 0.57, 1.15, 2.29, and 4.58 μmol/L at 30 μL/min for 180 s. The x‐axis indicates time, and the y‐axis represents resonance units (RU). B, Competitive ELISA was used to analyze the competitive affinity of DTLP with EGFR mAb (Left) and HER‐2 mAb (Right). After coating with the receptor, different concentrations of rabbit anti‐EGFR/or anti‐HER‐2 antibody or mixture of antibody and protein were added to incubate for 2 h at 37°C before detection. HRP‐conjugated goat anti‐rabbit IgG were used as the secondary antibody, followed by incubation with TMB used as a substrate solution. C, Protein levels of EGFR and HER‐2 in different pancreatic cell lines analyzed by Western blotting assay, and quantitative evaluation for each line were performed by using GraphPad Prism 6.0 software (GraphPad Software, San Diego, CA, USA). D, The binding affinity of DTLP proteins with different pancreatic cells analyzed by ELISA. Cells were incubated with 50 μL of protein at 4°C overnight. Rabbit anti‐His‐tag antibody and HRP‐conjugated goat anti‐rabbit IgG were used as the primary and secondary antibodies, respectively. For all graphs, error bars indicate SD for n = 3
Figure 3
Figure 3
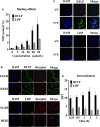
DTLP effectively internalized into MIA‐paca‐2 cells after bispecific binding to EGFR and HER‐2. A, MIA‐paca‐2 cells were incubated with FITC‐labeled DTLP protein and LDP protein at indicated concentrations, and the mean fluorescence intensities (MFIs) were analyzed by flow cytometry. Following FACS, MFI/Control were plotted vs protein concentrations representing three repeated times analyzed with GraphPad Prism 6.0 software. B, Colocalization of DTLP with EGFR (Right) and HER‐2 (Left) on MIA‐paca‐2 cells analyzed by laser scanning confocal microscopy (400×). Immobilized cells were incubated with anti‐EGFR or HER‐2 antibody (1:500 in dilution) as well as 1 μmol/L of FITC‐labeled DTLP/or LDP at 4℃ for 1 h, respectively, followed with fluorescently labeled secondary antibody (1:200 in dilution) added in order. DAPI is shown in blue for nuclei with DTLP/or LDP in green and EGFR and HER‐2 in red, followed by merged images (MERGE) obtained by superimposing DAPI, anti‐EGFR/or HER2 mAbs, and DTLP/LDP. C, Internalization of DTLP in MIA‐paca‐2 cells was detected by laser scanning confocal microscopy (400×). Living cells with 10 μmol/L of FITC‐labeled DTLP/or LDP were incubated for 1 h at 4 and 37°C successively to allow the proteins into cells. Blue indicates nuclei stained with DAPI, while green represents DTLP/or LDP labeled with FITC. MERGE indicates superimposed DAPI and DTLP/LDP. D, Internalization of FITC‐labeled DTLP/LDP in MIA‐paca‐2 cells at various times detected by flow cytometry. After incubation with FITC‐labeled proteins at 4°C for 1 h, cells were resuspended at 37°C and collected to measure their fluorescence intensity at various times. Following FACS, MFI/Control was plotted vs times after three repeated experiments. For all graphs, error bars indicate SD for n = 3. SD values were calculated with GraphPad Prism 6.0 software. Scale bars indicate 20 μm
Figure 4
Figure 4
DTLP specifically enriches in tumor tissues of MIA‐paca‐2 CDX mouse models. A, Fluorescent images of tumors in MIA‐paca‐2 xenograft mice were obtained at different times after tail vein injection of FITC‐labeled DTLP at 15 mg/kg. Green fluorescence represents FITC‐labeled DTLP, with black circles indicating tumor areas. Color scale represents photons/s/cm2/steradian. After the volume of inoculated tumor reached approximately 300 mm3, FITC‐labeled DTLP was injected into the tail vein of mice (n = 3) at dosages of 15 mg/kg. Xenograft mice were subjected to optical imaging at various time points after injection: 1, 2, 4, 8, 12, 24, 48, and 72 h. B, Tissues including tumor, heart, lung, liver, spleen, stomach, kidney, and bladder of mice from (A) were excised and treated, as described in (A) after 72 h of treatment of FITC‐labeled DTLP. Distribution of fluorescent signals was detected with numbers labeling in vitro imaging analysis. The color bar was scored gradually according to the fluorescent intensity
Figure 5
Figure 5
DTLL promotes inhibition of proliferation, cycle arrest and apoptosis of pancreatic cancer cells. A, The inhibition rate of MIA‐paca‐2 cell growth was detected by MTS assay. Cells were treated with different concentrations of tested agents including DTLL, LDM, and gemcitabine at indicated concentrations for 48 h at 37°C. B, The inhibition rate of MIA‐paca‐2 cell growth was detected using a clonogenic assay with the same treatments as (A) except that the medium was replaced with drug‐free medium after 24 h. C, Flow cytometry analysis was performed to measure apoptosis of MIA‐paca‐2 cells induced by DTLL/or LDM at 0.1 and 1 nmol/L for 24 h. D, MIA‐paca‐2 cells were exposed to DTLL and LDM at different concentrations (0.01 and 0.1 nmol/L), and cell cycle distribution was determined by flow cytometry after PI staining. The SD values for three repeated experiments were calculated with GraphPad Prism 6.0 software
Figure 6
Figure 6
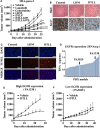
DTLL repressed pancreatic carcinoma growth of CDX and PDX mouse models. A, Nude mice (n = 5) bearing human pancreatic carcinoma MIA‐paca‐2 xenograft were treated with gemcitabine (ip 60 mg/kg), LDM (iv 0.05 mg/kg), DTLP (iv 1 mg/kg), or DTLL (iv 0.05 or 0.075 mg/kg of the LDM‐equivalent dose) on Day 0 and Day 10 after tumor formation, respectively. Lapatinib (ig 75 mg/kg) was given once a day. The mean values of tumor volumes in each group are shown with error bars for SD values (n = 5). **P < 0.01 when compared each group with the control while ***P < 0.001. ### P < 0.001 compared with the LDM‐treated group. B, Sections from paraffin‐embedded MIA‐paca‐2 xenograft tumors were stained by Hematoxylin and Eosin (H&E) (upper panels) and Ki‐67 IHC (lower panels) (×400). Scale bars indicate 100 μm. C, Apoptosis in MIA‐paca‐2 xenograft tumors was measured using TUNEL assay. TUNEL positive cells shown in red fluorescence were detected, and DAPI is shown in blue. MERGE represents merged DAPI and TUNEL signals. Scale bars indicate 100 μm. D, RNA sequencing data from tumor samples of HuPrime® PDX models in a variety of pancreatic carcinoma patients were plotted to determine expression levels of EGFR mRNA with two selected models, PA1338 in red and PA3029 in yellow, shown by arrows. For efficacy evaluation, two selected PDX models with high (E) and low (F) levels of EGFR expression were administered in nude mice (n = 5) with vehicle or DTLL at the LDM‐equivalent dose of 0.1 mg/kg once a week for 3 wk, respectively. Tumor volumes were measured after animals were sacrificed on Day 24 and 39, respectively. ***P < 0.001.
Figure 7
Figure 7
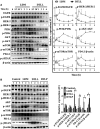
DTLL exhibits an antineoplastic effect through EGFR/HER2‐dependent inhibitions of PI3K/AKT/mTOR signaling and PD‐L1‐mediated escape from immunosurveillance. A, Western blotting assays were used to test protein levels of MIA‐paca‐2 cells treated with DTLL/or LDM at 0.1 nmol/L of the LDM‐equivalent dose for 15 and 30 min, and 1, 2, 3, and 4 h with β‐actin as an internal reference gene. Band intensities were quantified using ImageJ. Data shown are representative of three experiments. Statistical significance was evaluated using unpaired t test using GraphPad Prism 6.0 software. B, Protein levels in tumor samples of MIA‐paca‐2 CDX mouse models were determined by Western blotting. Data were analyzed as described in (A)

Similar articles

Cited by

References

    1. Meng Q, Shi S, Liang C, et al. Diagnostic and prognostic value of carcinoembryonic antigen in pancreatic cancer: a systematic review and meta‐analysis. Onco _targets Ther. 2017;10:4591‐4598. - PMC - PubMed
    1. Kieler M, Unseld M, , Bianconi D, Prager GW. Cross‐over comparison and new chemotherapy regimens in metastatic pancreatic cancer. Memo. 2017;10:136‐140. - PMC - PubMed
    1. Siegel RL, Miller KD, Jemal A. Cancer statistics, 2016. CA Cancer J Clin. 2016;66:7‐30. - PubMed
    1. Burris HA 3rd, Moore MJ, Andersen J, et al. Improvements in survival and clinical benefit with gemcitabine as first‐line therapy for patients with advanced pancreas cancer: a randomized trial. J Clin Oncol. 1997;15:2403‐2413. - PubMed
    1. Giordano G, Pancione M, Olivieri N, et al. Nano albumin bound‐paclitaxel in pancreatic cancer: current evidences and future directions. World J Gastroenterol. 2017;23:5875‐5886. - PMC - PubMed

Publication types

MeSH terms

  NODES
eth 1
see 2
Story 1
twitter 2