. 2019 Mar 6;101(5):938-949.e4.
doi: 10.1016/j.neuron.2019.01.013. Epub 2019 Feb 4.

Neuronal Regulation of Fast Synaptotagmin Isoforms Controls the Relative Contributions of Synchronous and Asynchronous Release

Affiliations

Neuronal Regulation of Fast Synaptotagmin Isoforms Controls the Relative Contributions of Synchronous and Asynchronous Release

Josef Turecek et al. Neuron. .

Abstract

Neurotransmitter release can be synchronous and occur within milliseconds of action potential invasion, or asynchronous and persist for tens of milliseconds. The molecular determinants of release kinetics remain poorly understood. It has been hypothesized that asynchronous release dominates when fast Synaptotagmin isoforms are far from calcium channels or when specialized sensors, such as Synaptotagmin 7, are abundant. Here we test these hypotheses for GABAergic projections onto neurons of the inferior olive, where release in different subnuclei ranges from synchronous to asynchronous. Surprisingly, neither of the leading hypotheses accounts for release kinetics. Instead, we find that rapid Synaptotagmin isoforms are abundant in subnuclei with synchronous release but absent where release is asynchronous. Viral expression of Synaptotagmin 1 transforms asynchronous synapses into synchronous ones. Thus, the nervous system controls levels of fast Synaptotagmin isoforms to regulate release kinetics and thereby controls the ability of synapses to encode spike rates or precise timing.

Keywords: Syt7; asynchronous release; cerebellum; inferior olive; short-term plasticity; synaptotagmin.


Conflict of interest statement

Declaration of Interests. The authors declare no competing interests.

Figures

Figure 1:
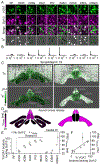
Figure 1:. GABA release in the IO ranges from synchronous to asynchronous.
A, Sagittal view showing cells in the deep cerebellar nuclei (DCN) forming GABAergic synapses in the inferior olive (IO). B, Evoked IPSCs in response to a single stimulus in the rostral dorsal cap of Kooy (rDCK, left), rostral beta subnucleus (rIOBe, middle) and principal IO (PIO, right), with averages (black) and single trials (gray). C, Coronal outline of the rostral (left) and caudal (right) IO. Each marker is a single cell, the color map corresponds to the decay time of the averaged IPSC. (DAO, dorsal accessory olive; rMAO, medial accessory olive; cDCK, caudal dorsal cap of Kooy; IOB/A, subnuclei A-B; IOBe/C, beta/C subnuclei). D, Plot of average decay time for individual cells in each IO subnucleus. Number of experiments in Table S1. See also Figure S1.
Figure 2:
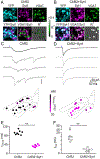
Figure 2:. The presence of Syt7 does not confer asynchronous release onto DCN-IO synapses.
A, Coronal view of the rostral IO with subnuclei outlined immunostained for VGAT (top) and Syt7 (middle). VGAT was used as a mask to display the intensity of Syt7 at inhibitory synapses (bottom), with regions lacking VGAT staining shown in grey. Examples are from a wildtype (left) and Syt7 KO (right). Scalebar, 200 μm. B, Same as in A, but for the caudal IO. C, Median intensity of Syt7 in VGAT-positive boutons for each subnucleus (Syt7 KO signal subtracted). D, Average IPSC decay time plotted against median Syt7 intensity at VGAT boutons for each subnucleus, with IOBe/C (white) and IOB/A (dark) highlighted. Markers are mean ± s.e.m. for decay time, and median Syt7 intensity for all measured boutons within each subnucleus. E, Individual boutons in the caudal IO from the IOB/A (left), and IOBe/C (right) from areas indicated in B from a wildtype animal. Images are from single sections. Scalebar, 2 μm. F, Example evoked synchronous IPSCs in the IOB/A (left), and asynchronous IPSCs from a cell in the IOBe/C (right), with averaged IPSCs (black) and individual trials shown (gray). G, summary of decay kinetics of averaged IPSCs in the IOBe/C and IOB/A. Markers are individual cells. H, Low intensity stimuli evoked asynchronous IPSCs from the PIO in a wildtype animal (left), and from a Syt7 KO (right) with averages (top) and individual trials (bottom). I, Averaged IPSCs normalized to peak amplitudes for examples shown in H. J, Half-rise (left) and time constants of decay (right) of averaged IPSCs for wildtype and Syt7 KOs. K, Example IPSCs evoked by high intensity stimulation in the PIO of wildtype and Syt7 KOs. L, Properties of currents evoked by maximal intensity showing amplitude (left), half-rise and decay (middle) times and total charge (right). Markers are individual cells. ** p < 0.01, unpaired two-tailed Student’s t-test. Number of experiments in Table S1. See also Figure S2.
Figure 3:
Figure 3:. Syt7 clamps spontaneous release only in areas where there is prominent asynchronous release.
A, Examples of mIPSCs (left) from the rostral dorsal cap of Kooy (rDCK, top) and principal inferior olive (PIO, bottom) in a wildtype animal. Summary of all wildtype cells color-coded by mIPSC frequency in the rostral (middle) and caudal IO (right). B, Examples of mIPSCs for the rDCK (top) and PIO (bottom) in a Syt7 KO. Summary for all Syt7 KO cells are shown for rostral (middle) and caudal IO (right). C, Plot of mIPSC frequency for wildtype and Syt7 KO cells for each subnucleus. Subnuclei are arranged in order based on IPSC kinetics, ranging from predominantly synchronous (Sync.), to both synchronous and asynchronous (Mixed), to exclusively asynchronous (Async.). Data are individual cells. D, Difference in average mIPSC frequency (Syt7 KO – wildtype; mean ± s.e.m.) for each subnucleus in C. Number of experiments in Table S1. *p<0.05, **p<0.01, two-tailed student’s t-test.
Figure 4:
Figure 4:. GABAergic synapses in some IO subnuclei lack sensors for fast vesicle fusion.
A, Coronal image of ventral brainstem immunostained for VGAT (top) and Syt1/Syt2 (bottom). Dashed line indicates midline, with reticular formation (RF) and dorsal accessory olive (DAO) outlined. Scalebar, 200 μm. B, High-power single-plane view of VGAT-positive boutons in RF (left) and DAO (right). Raw images shown from top to bottom for VGAT, Syt1/2, merged channels, and correlation analysis. YZ and XY planes indicated by yellow ticks. Scalebar, 1 μm. C, same as in A but for VGLUT2 and Syt1/2. D, same as in B, but for VGLUT2. E, Comparison of confocal (left) and 3D-SIM (right) in the RF. Scalebar, 1 μm. F, Same as in E, but for the DAO. G, Distribution of correlation coefficient values for confocal (dark) and 3D-SIM (light) in the RF (left) and DAO (right). **p<0.01, K-S test. Number of experiments in Table S1. See also Figure S3–4.
Figure 5:
Figure 5:. Lack of Syt1/2 in GABAergic synapses correlates to asynchronous release in the IO.
A, Example single-plane views of GABAergic boutons, Syt1/2, and correlation analysis for IO subnuclei. Scalebar, 2 μm. B, Distribution of correlation coefficient values for all regions normalized by number of boutons within each subnucleus. C, Map of correlation coefficient values for rostral (left) and caudal (right) ventral brainstem (top) with IO subnuclei segmented and labeled (bottom). Scalebar, 200 μm. D, Map of the rostral (left) and caudal (right) IO color mapped for the average IPSC τdecay. E, Plot of the fraction of GABAergic boutons lacking Syt1/2 (R2 < 0.1, empty markers) and average IPSC decay time (filled gray) for subnuclei and reticular formation (RF). F, Plot of average IPSC decay time vs. fraction of VGAT boutons lacking Syt1/2 (R2 < 0.1). Each marker is data from one subnucleus. Physiology data are mean ± s.e.m., anatomy are individual animals. Number of experiments in Table S1.
Figure 6:
Figure 6:. Expression of Syt1 is sufficient to drive synchronous release at typically asynchronous synapses.
A, GABAergic boutons in the PIO expressing ChR2-YFP alone immunostained for VGAT and Syt1. Scalebar, 2 μm. B, Same as in A but expressing ChR2-YFP and Syt1. C, Release evoked by optical simulation in one cell when ChR2 was expressed alone (top) and map of decay time for all cells in the rostral IO (bottom) D, Same as in C, but for ChR2 and Syt1 expression. E, Summary of decay time for optical stimulation of ChR2 alone or ChR2+Syt1 in the PIO. F, Same as in E but for rise time. Markers are individual cells. **p<0.01, Two-tailed Student’s t-test. Number of experiments in Table S1.

Similar articles

Cited by

References

    1. ABBOTT LF & REGEHR WG 2004. Synaptic computation. Nature, 431, 796–803. - PubMed
    1. ATLURI PP & REGEHR WG 1998. Delayed release of neurotransmitter from cerebellar granule cells. J Neurosci, 18, 8214–27. - PMC - PubMed
    1. BACAJ T, WU D, YANG X, MORISHITA W, ZHOU P, XU W, MALENKA RC & SUDHOF TC 2013. Synaptotagmin-1 and synaptotagmin-7 trigger synchronous and asynchronous phases of neurotransmitter release. Neuron, 80, 947–59. - PMC - PubMed
    1. BEST AR & REGEHR WG 2008. Serotonin evokes endocannabinoid release and retrogradely suppresses excitatory synapses. J Neurosci, 28, 6508–15. - PMC - PubMed
    1. BEST AR & REGEHR WG 2009. Inhibitory regulation of electrically coupled neurons in the inferior olive is mediated by asynchronous release of GABA. Neuron, 62, 555–65. - PMC - PubMed

Publication types

MeSH terms

LinkOut - more resources

  NODES
Project 1
twitter 2