. 2019 Mar 4;20(5):1106.
doi: 10.3390/ijms20051106.

Transcriptome and Proteome-Based Network Analysis Reveals a Model of Gene Activation in Wheat Resistance to Stripe Rust

Affiliations

Transcriptome and Proteome-Based Network Analysis Reveals a Model of Gene Activation in Wheat Resistance to Stripe Rust

Hong Zhang et al. Int J Mol Sci. .

Abstract

Stripe rust, caused by the pathogen Puccinia striiformis f. sp. tritici (Pst), is an important fungal foliar disease of wheat (Triticum aestivum). To study the mechanism underlying the defense of wheat to Pst, we used the next-generation sequencing and isobaric tags for relative and absolute quantification (iTRAQ) technologies to generate transcriptomic and proteomic profiles of seedling leaves at different stages under conditions of pathogen stress. By conducting comparative proteomic analysis using iTRAQ, we identified 2050, 2190, and 2258 differentially accumulated protein species at 24, 48, and 72 h post-inoculation (hpi). Using pairwise comparisons and weighted gene co-expression network analysis (WGCNA) of the transcriptome, we identified a stress stage-specific module enriching in transcription regulator genes. The homologs of several regulators, including splicing and transcription factors, were similarly identified as hub genes operating in the Pst-induced response network. Moreover, the Hsp70 protein were predicted as a key point in protein⁻protein interaction (PPI) networks from STRING database. Taking the genetics resistance gene locus into consideration, we identified 32 induced proteins in chromosome 1BS as potential candidates involved in Pst resistance. This study indicated that the transcriptional regulation model plays an important role in activating resistance-related genes in wheat responding to Pst stress.

Keywords: WGCNA; iTRAQ; splicing regulator; stripe rust; transcriptome-proteome associated analysis; wheat.


Conflict of interest statement

The authors declare no competing financial interest.

Figures

Figure 1
Figure 1
Number of differentially accumulated proteins (DAPs) in wheat infected by stripe rust. (A). Bar chart. The blue and red bars represent up- and down-regulated DAPs, respectively. The numbers of test comparisons are shown above each bar. S1, S2, and S3 represents the samples of Pst-inoculated at 24, 48, and 72 hpi, while Ck means the mock-inoculated sample. (B). Venn diagram. The number of specific and overlapped DAPs between timepoints were given.
Figure 2
Figure 2
Gene ontology (GO) classifications of the differentially accumulated proteins (DAPs) identified in isobaric tags for relative and absolute quantification (iTRAQ) of Pst-infected wheat leaves at 24 hpi. The level2 GO terms are shown below each bar, while ontology classes biological process, Cellular component and molecular function are represented by green, red and blue bars, respectively. The number of DAPs was shown as the ordinate.
Figure 3
Figure 3
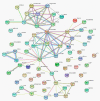
Interaction networks of response to stress related DAPs identified by isobaric tags for relative and absolute quantification (iTRAQ). Protein–protein interaction network constituted by DAPs identified in N9134 responding to Pst stress and known protein-species related to defense and response to biotic stimulus in the Database, Experiment, or Text Mining databases. The purples lines represent experimental evidence. The green lines represent gene neighborhood, while the blue lines represent gene co-occurrence database evidence. The yellow lines represent textmining evidence; and the black lines represent the co-expression evidence. U1A, Spliceosomal protein U1A; AT4G03120, C2H2 and C2HC containing protein (Component of the U1 snRNP C); TIM, Triosephosphate isomerase; AT3G11830, TCP-1/cpn60 chaperonin family protein; SHM3, Serine hydroxymethyltransferase 3; SGT1, Suppressor of the G2 allele of skp1; NHO1, Glycerol kinase; PR1, Pathogenesis-related gene 1; MDHAR, Monodehydroascorbate reductase; OASB, Cysteine synthase; AGT, Alanine-glyoxylate aminotransferase; ATPQ, ATP synthase subunit d; PDIL2-2, PDI-like 2-2(protein disulfide isomerase); TIM, Triosephosphate isomerase; CAT, Catalase 2; AT1G30870, Peroxidase 7; AT1G05240, Peroxidase 1/2; AT5G51890, Peroxidase 66; CTL2, Chitinase-like protein 2.
Figure 4
Figure 4
Weighted gene co-expression network analysis of genes in Pst- and Bgt-infected wheat young leaves tissues. The expressed genes were clustered into 18 modules labeled by different colors (not gray). Each row corresponds to one module. The number of genes in each module is indicated on the left. Each column corresponds to a specific sample. The color of each cell at the row-column intersection indicates the correlation coefficient between the module and the sample. The value of the correlation between a specific module and sample is indicated by the scale bar on the right. The letter P and S in X-axis referred to the Bgt and Pst stress respectively, while the following number 1, 2, and 3 represent the samples collected at 24, 48, and 72 hpi after inoculation. Similarly, R1, R2, and R3 mean the replications and sample number. The specific modules of wheat responding to Pst are marked with an asterisk.
Figure 5
Figure 5
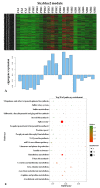
Construction of Pst-induced specific gene modules and networks. (A). Heat map and eigengene expression profile for the skyblue2 (24 hpi) module in leaves of Pst-inoculated wheat resistance line N9134. The y-axis indicates the value of the module eigengene; the x-axis indicates sample type. The letter P and S in X-axis referred to the Bgt and Pst stress respectively, while R showed the replications. Heat map shows the relative FPKM of each gene. (B). The top 20 KEGG pathway enrichment categories of differentially expressed genes (DEGs) in skyblue2 module. The KEGG pathways are listed on the left, while Q-values and gene numbers are shown on the right. (C). The correlation network of the skyblue2 module. Sixty-six genes with edge weight >0.1 are visualized using Cytoscape_v.3.0.0. Twenty-three genes related to spliceosome components or transcription-related regulators are marked with abbreviated gene names, while the others were marked with URGI gene numbers. The diameter of the circles is proportional to connectivity.
Figure 5
Figure 5
Construction of Pst-induced specific gene modules and networks. (A). Heat map and eigengene expression profile for the skyblue2 (24 hpi) module in leaves of Pst-inoculated wheat resistance line N9134. The y-axis indicates the value of the module eigengene; the x-axis indicates sample type. The letter P and S in X-axis referred to the Bgt and Pst stress respectively, while R showed the replications. Heat map shows the relative FPKM of each gene. (B). The top 20 KEGG pathway enrichment categories of differentially expressed genes (DEGs) in skyblue2 module. The KEGG pathways are listed on the left, while Q-values and gene numbers are shown on the right. (C). The correlation network of the skyblue2 module. Sixty-six genes with edge weight >0.1 are visualized using Cytoscape_v.3.0.0. Twenty-three genes related to spliceosome components or transcription-related regulators are marked with abbreviated gene names, while the others were marked with URGI gene numbers. The diameter of the circles is proportional to connectivity.
Figure 6
Figure 6
Interaction networks of defense-related DAPs identified by iTRAQ with differential expressed genes in skyblue2 module together. Protein–protein interaction network constituted by DAPs and DEGs identified in N9134 responding to Pst stress. The purples lines represent experimental evidence. The green lines represent gene neighborhood, while the blue lines represent gene co-occurrence database evidence. The yellow lines represent textmining evidence; and the black lines represent the co-expression evidence. HSP70, Heat shock protein 70; U1A, Spliceosomal protein U1A; U2AF35B, Splicing factor U2af small subunit B; DCP2, mRNA-decapping enzyme subunit 2; AT2G16860, pre-mRNA-splicing factor SYF2; AT2G33730, DEAD-box ATP-dependent RNA helicase 21; AT1G51380, DEAD-box ATP-dependent RNA helicase 34; PRPL28, 60S ribosomal protein L28-1; AT3G49910, 60S ribosomal protein L26-1; AT4G25550, Cleavage/polyadenylation specificity factor; AT3G03000, Putative calcium-binding protein CML18; GR-RBP2, Glycine-rich RNA-binding protein 2; PIL6, Transcription factor PIF5; RPS5, Resistant to p. syringae 5; CDPK6, Calcium-dependent protein kinase 6; PR1, Pathogenesis-related gene 1.
Figure 7
Figure 7
Transcriptome-proteome-associated analysis of gene expression in Pst-infected wheat leaf tissues. The x-axis indicates the level of DAP accumulation detected in the proteomic analysis, while the y-axis indicates the level of DEG expression detected in the transcriptome analysis. The Pearson correlation p-values are indicated above each plot. A, B, and C represent different analysis at 24, 48, and 72 hours after inoculation, respectively. Each plot is divided into nine quadrants (1, 2, 3 at the top; 4, 5, 6 in the middle; and 7, 8, 9 at the bottom, ordered from left to right), which indicate the correction of gene expression at the transcript and proteins levels.

Similar articles

Cited by

References

    1. McIntosh R., Yamazaki Y., Dubcovsky J., Rogers J., Morris C., Appels R., Xia X. Catalogue of gene symbols for wheat 2013–2014 supplement; Proceedings of the 12th International Wheat Genetic Symposium; Yokohama, Japan. 8–13 September 2013.
    1. Zhao J., Wang M., Chen X., Kang Z. Role of Alternate Hosts in Epidemiology and Pathogen Variation of Cereal Rusts. Annu. Rev. Phytopathol. 2016;54:207–228. doi: 10.1146/annurev-phyto-080615-095851. - DOI - PubMed
    1. Zhang H., Zhang L., Wang C., Wang Y., Zhou X., Lv S., Liu X., Kang Z., Ji W. Molecular mapping and marker development for the Triticum dicoccoides-derived stripe rust resistance gene YrSM139-1B in bread wheat cv. Shaanmai 139. Theor. Appl. Genet. 2016;129:369–376. doi: 10.1007/s00122-015-2633-7. - DOI - PubMed
    1. Miller R.N., Costa Alves G.S., Van Sluys M.A. Plant immunity: Unravelling the complexity of plant responses to biotic stresses. Ann. Bot. 2017;119:681–687. doi: 10.1093/aob/mcw284. - DOI - PMC - PubMed
    1. Zhang H., Yang Y., Wang C., Liu M., Li H., Fu Y., Wang Y., Nie Y., Liu X., Ji W. Large-scale transcriptome comparison reveals distinct gene activations in wheat responding to stripe rust and powdery mildew. BMC Genom. 2014;15:898. doi: 10.1186/1471-2164-15-898. - DOI - PMC - PubMed

MeSH terms

LinkOut - more resources

  NODES
INTERN 1
twitter 2