. 2019 Mar 12;14(1):6.
doi: 10.1186/s13064-019-0130-4.

Persistent motor dysfunction despite homeostatic rescue of cerebellar morphogenesis in the Car8 waddles mutant mouse

Affiliations

Persistent motor dysfunction despite homeostatic rescue of cerebellar morphogenesis in the Car8 waddles mutant mouse

Lauren N Miterko et al. Neural Dev. .

Abstract

Background: Purkinje cells play a central role in establishing the cerebellar circuit. Accordingly, disrupting Purkinje cell development impairs cerebellar morphogenesis and motor function. In the Car8wdl mouse model of hereditary ataxia, severe motor deficits arise despite the cerebellum overcoming initial defects in size and morphology.

Methods: To resolve how this compensation occurs, we asked how the loss of carbonic anhydrase 8 (CAR8), a regulator of IP3R1 Ca2+ signaling in Purkinje cells, alters cerebellar development in Car8wdl mice. Using a combination of histological, physiological, and behavioral analyses, we determined the extent to which the loss of CAR8 affects cerebellar anatomy, neuronal firing, and motor coordination during development.

Results: Our results reveal that granule cell proliferation is reduced in early postnatal mutants, although by the third postnatal week there is enhanced and prolonged proliferation, plus an upregulation of Sox2 expression in the inner EGL. Modified circuit patterning of Purkinje cells and Bergmann glia accompany these granule cell adjustments. We also find that although anatomy eventually normalizes, the abnormal activity of neurons and muscles persists.

Conclusions: Our data show that losing CAR8 only transiently restricts cerebellar growth, but permanently damages its function. These data support two current hypotheses about cerebellar development and disease: (1) Sox2 expression may be upregulated at sites of injury and contribute to the rescue of cerebellar structure and (2) transient delays to developmental processes may precede permanent motor dysfunction. Furthermore, we characterize waddles mutant mouse morphology and behavior during development and propose a Sox2-positive, cell-mediated role for rescue in a mouse model of human motor diseases.

Keywords: Ataxia; Dystonia; Granule cell; Lobule; Proliferation; Purkinje cell; Stem cells; Tremor.


Conflict of interest statement

Ethics approval and consent to participate

All animal studies were carried out under an approved Institutional Animal Care and Use Committee (IACUC) animal protocol according to the institutional guidelines at Baylor College of Medicine (BCM).

Consent for publication

Not applicable.

Competing interests

The authors declare that they have no competing interests.

Publisher’s Note

Springer Nature remains neutral with regard to jurisdictional claims in published maps and institutional affiliations.

Figures

Fig. 1
Fig. 1
Purkinje cells in Car8wdl mice do not express carbonic anhydrase VIII (CAR8). (a-c) Purkinje cells in P5 control mice (n = 3) express both calbindin and CAR8. (d-f) Calbindin and CAR8 are co-expressed in Purkinje cells as seen in lobules V and VI in P5 control mice (n = 3). (g-i) Purkinje cells in Car8wdl mutant mice expressed calbindin, but not CAR8, as seen in lobules V and VI at P5 (n = 3). The scale bar represents 50 μm.
Fig. 2
Fig. 2
Purkinje cell firing is irregular in awake, behaving Car8wdl mice. (a) A schematic showing a cerebellar recording in an awake mouse. (b) Example recordings from control (n = 9 cells from 3 mice) and Car8wdl mutant (n = 10 cells from 4 mice) Purkinje cells using metal electrodes for extracellular recordings. Examples of complex spikes are labeled with asterisks. (c) The overall regularity and local spike-to-spike regularity are severely disrupted in Car8wdl mice. These measures reflect the highly irregular activity of the mutant Purkinje cells. Abbreviations: Simple spike coefficient of variation, SS CV; Simple spike coefficient of variation of adjacent intervals, SS CV2. ** p < 0.01; **** p < 0.0001; Student’s t-test; mean ± SEM
Fig. 3
Fig. 3
Car8wdl cerebella have a normal lobule pattern but are smaller at P5. (a-e) Whole mount images of control and Car8wdl cerebella at ages P5, P10, P15, P20, and adult (> 2 months) show normal lobulation in both groups. The scale bar represents 2 mm. (f-j) H&E stained tissue sections at ages P5 (n = 4 controls, 3 mutants), P10, P15, P20, and adult (> 2 months; P10-Adult n = 12 controls, 14 mutants) suggest a reduction in Car8wdl cerebellar size at P5 compared to its age-matched control. The scale bar represents 1 mm. (k-o) Overlay images to compare control (blue) and Car8wdl (red) cerebellar tissue sections show a transient reduction in overall cerebellar size at P5, but then is recovered by P10. The scale bar represents 1 mm
Fig. 4
Fig. 4
EGL proliferation in the Car8wdl mutants recovers by P20. (a) Schematic of tissue orientation and quantification location. White and yellow dotted lines delineate inner EGL boundaries of lobules V and VI. The scale bar represents 50 μm. (b) Granule cell proliferation is abnormal in developing Car8wdl mice. * p < 0.05; ** p < 0.01; **** p < 0.0001; One-way ANOVA; Tukey’s multiple comparisons post-hoc test; Mean ± SEM. (c-d) There are significantly fewer proliferating cells total and per 50 μm in the EGL of Car8wdl mice (n = 8) than in the EGL of control mice (n = 9) at P5. * p < 0.05; Student’s t-test; Mean ± SEM. (e-f) The number (no) of proliferating cells total and per 50 μm in the EGL of Car8wdl mice (n = 8) is not significantly different from that in the EGL of control mice (n = 7) at P10. p = 0.7691; Student’s t-test; Mean ± SEM. (g-h) There are more proliferating cells total and per 50 μm in the EGL of Car8wdl mice (n = 11) than in the EGL of control mice (n = 7) at P15. * p < 0.05; Student’s t-test; Mean ± SEM. (i-j) The number (no) of proliferating cells total and per 50 μm in the EGL of Car8wdl mice (n = 7) is not significantly different from that in the EGL of control mice (n = 5) at P20. p = 0.9930; Student’s t-test; Mean ± SEM. The scale bar represents 50 μm
Fig. 5
Fig. 5
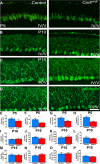
EGL size but not ML thickness recovers by P20. (a) Schematic of tissue orientation and quantification location. (b) ML thickness increases as the EGL area decreases during postnatal development in both control and Car8wdl mice. *** p < 0.001; **** p < 0.0001; One-way ANOVA; Tukey’s multiple comparisons post-hoc test; Mean ± SEM. (c-d) Both the ML thickness (n = 3 mutants, n = 5 controls) and EGL area (n = 8 mutants, n = 10 controls) are not significantly different between Car8wdl mutants and control mice at P5. ML thickness, p = 0.9631; EGL area, p = 0.8605; Student’s t-test; Mean ± SEM. (e-f) Both the ML thickness (n = 7 mutants, n = 6 controls) and EGL area (n = 10 mutants, n = 9 controls) are not significantly different between Car8wdl mutants and control mice at P10. ML thickness, p = 0.6896; EGL area, p = 0.1965; Student’s t-test; Mean ± SEM. (g-h) The EGL area (n = 10 mutants, n = 8 controls), but not ML thickness (n = 8 mutants, n = 6 controls) is significantly larger in P15 Car8wdl mutant mice compared to control mice. ML thickness, p = 0.8727; EGL area, * p < 0.05; Student’s t test; Mean ± SEM. (i-j) The EGL area in Car8wdl mutant mice (n = 9) normalizes to controls (n = 6), but its ML (n = 3 mutants, n = 4 controls) is now larger at P20. ML thickness, * p < 0.05; EGL area, p = 0.1211; Student’s t test; Mean ± SEM. The scale bar represents 50 μm
Fig. 6
Fig. 6
Abnormal Purkinje cell morphology at P5 recovers by P15. (a) Based on anatomical assessments, Purkinje cells in Car8wdl cerebella are qualitatively abnormal at P5 when compared to Purkinje cells in control cerebella. (b-d) The architectural appearance of Purkinje cell dendritic arborization looks normal in Car8wdl cerebella from P10 to P20. The scale bar represents 50 μm. (e-h) Quantifying dendritic tree length, width, area, and branching at P5 revealed significant differences in 3 of the 4 parameters (n = 3 mice per genotype). Car8wdl Purkinje cells (n = 210) are narrower, cover a smaller area, and have fewer branches (n = 180 control cells) compared to controls. Dendrite length, p = 0.2015; Dendrite width, ** p < 0.01; Dendrite area, * p < 0.05; Branch number (no), ** p < 0.01; Student’s t test; Mean ± SEM. (i-l) Car8wdl Purkinje cells (n = 112) no longer cover a smaller area, no longer have fewer branches, and their dendritic trees are no longer narrower at P10 (n = 80 control cells; n = 3 mice per genotype). Dendrite length, p = 0.6386; Dendrite width, p = 0.2251; Dendrite area, p = 0.6216; Branch number, p = 0.3305; Student’s t-test; Mean ± SEM. (m-p) Purkinje cell morphology (n = 80 mutant cells, 64 control cells) is normal across all parameters at P15 (n = 3 mice per genotype). Dendrite length, p = 0.7201; Dendrite width, p = 0.2766; Dendrite area, p = 0.8135; Branch number, p = 0.3486; Student’s t-test; Mean ± SEM
Fig. 7
Fig. 7
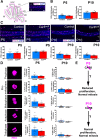
Loss of Car8 does not delay mitotic progression in granule cell progenitors. (a) Schematic of tissue orientation and quantification location. (b) The number (no) of mitotically active cells in the P5 (n = 4) and P10 (n = 4) Car8wdl EGL is comparable to that in the P5 (n = 4) and P10 (n = 7) control EGL. P5, p = 0.5653; P10, p = 0.1773; Student’s t-test; Mean ± SEM. (c) The number (no) and density of PH3-positive cells in lobules V-VI of Car8wdl EGL (n = 4 at P5, 4 at P10) was not significantly different from that of lobules V-VI of control EGL (n = 4 at P5, 7 at P10). P5, p = 0.8940; P10, p = 0.1698; Student’s t-test; Mean ± SEM. The scale bar represents 50 μm. (d) Car8wdl (n = 4) granule cells progress through mitosis normally at P5 (n = 4 controls) and also at P10 (n = 4 mutants, n = 7 controls). P5 Prophase, p = 0.8287; P5 Prometaphase, p = 0.0608; P5 Metaphase, p = 0.2968; P5 Anaphase, p = 0.6297; P5 Telophase, p = 0.3989; P10 Prophase, p = 0.1452; P10 Prometaphase, p = 0.3282; P10 Metaphase, p = 0.2245; P10 Anaphase, p = 0.2421; P10 Telophase, p = 0.1594; Student’s t-test; Mean ± SEM. The scale bar represents 20 μm. (e) Loss of CAR8 does not affect the mitotic progression of granule cells, but does transiently delay their proliferation, relative to age-matched controls
Fig. 8
Fig. 8
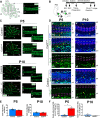
Sox2 expression is upregulated in the P5 Car8wdl EGL. (A) Schematic of tissue orientation and quantification location. (B) Timeline detailing the experiment by delineating the times of the procedures performed over the course of 11 days. Two schematics are included to illustrate the method of EdU injections for P5 and P10 pups. (C,E) The number (no) of EdU-positive cells per 50 μm in lobules V/VI of Car8wdl tissue is comparable to that of controls at P5 and P10. The scale bars represent 500 μm (zoomed out) and 50 μm (zoomed in). In the graphs (E), the number of cells per 50 μm that are in interphase (i.e. S-phase) are not significantly different between Car8wdl and control cerebella at P5 (n = 6 controls, n = 4 mutants) or P10 (n = 5 controls, n = 5 mutants). P5, p = 0.0728; P10, p = 0.6245; Student’ t-test; Mean ± SEM. (D,F) Car8wdl mice (n = 3) have more Sox2-positive cells (yellow arrowheads) in the inner EGL compared to control mice (n = 3) at P5. By P10, Sox2-positive cells are predominantly localized to the PCL and immediately adjacent areas in the Car8wdl (n = 3) cerebellum like in the control cerebellum (n = 3). White dotted lines delineate the outer EGL (o). Magenta lines delineate the inner EGL (i). The scale bars represent 50 μm in (D). Quantification of the number (no) of Sox2+ cells in the P5 and P10 mutant and control inner EGL (~ 50% of the EGL, i.e. within ~ 27,000 μm2 or ~ 14,000 μm2 of the EGL) confirms the abundance of Sox2+ cells that were observed in the imaged tissue (F). P5, * p < 0.05; P10, p = 0.3739; Student’s t-test; Mean ± SEM
Fig. 9
Fig. 9
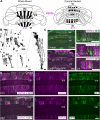
Zonal patterning of neurons and glia is delayed in developing Car8wdl mice. (a) Schematic of HSP25 expression in a whole mount and a superficial coronally sectioned P17 posterior cerebellum. The dotted horizontal line transecting the whole mount schematic represents the location at which the cerebellum was cut to get the coronal sections below. (b) Modified Golgi-Cox staining in control mice showing that Purkinje cells and Bergmann glia are located together in the Purkinje cell layer (n = 5). Bergmann glia have long processes that facilitate granule cell migration and Purkinje cell dendritic elaboration. The scale bars represent 200 μm (Purkinje cell and Bergmann glia, top left), 100 μm (enlarged Purkinje cell and Bergmann glia (bottom left); Bergmann glia (middle)), and 50 μm (enlarged Bergmann glia, right). The Bergmann glia are labeled as BG. (c) Purkinje cell somas (yellow arrowheads) are abnormally aligned in Car8wdl cerebella (n = 4), but not in control cerebella (n = 3) at P17. The scale bars represent 500 μm. (d) Double immunostaining in Car8wdl; NpyGFP transgenic mice with HSP25 and GFP reveal a zebrin II-like patterning in control (n = 3) and Car8wdl cerebella (n = 4). The scale bar represents 100 μm
Fig. 10
Fig. 10
Car8wdl mice have a high-stepping, tippy-toe gait that is indicative of dystonia. (a) Sample footprints from CatWalk for 3 control mice and 3 Car8wdl mutant mice. Also see Additional file 1: Movie S1 and Additional file 2: Movie S2. (b) Analysis of the footprints (n = 3 per genotype) recorded on CatWalk show that print length is not affected in Car8wdl mice (Forelimbs (p = 0.4444): control 0.8322 ± 0.01472 cm, mutant 0.8089 ± 0.02321 cm; Hindlimbs (p = 0.1977): control 0.8295 ± 0.02899 cm, mutant 0.7638 ± 0.03112 cm), but print width is reduced (Forelimbs (p = 0.0038): control 0.7811 ± 0.02154 cm, mutant 0.5755 ± 0.02632 cm; Hindlimbs (p = 0.0017): control 0.7180 ± 0.01177 cm, mutant 0.5919 ± 0.01220 cm). Accordingly, compared to control mice (Forelimbs: 0.2675 ± 0.001582 cm; Hindlimbs: 0.2505 ± 0.01276 cm), the print area is reduced in Car8wdl mice (Forelimbs: 0.1990 ± 0.02576 cm, p = 0.0567; Hindlimbs: 0.1934 ± 0.01509 cm, p = 0.0445). *** p < 0.01 and **** p < 0.0001 Student’s t test; Mean ± SEM
Fig. 11
Fig. 11
P20 Car8wdl mice have normal muscle strength but abnormal muscle coordination. (a) Despite an ataxic gait, grip strength is not impaired in Car8wdl adult mice (n = 8 per genotype). p = 0.8120; Student’s t test; Mean ± SEM. (b) Schematic of EMG electrode locations. TA = tibialis anterior; GC = gastrocnemius. (c) Bouts of TA muscle activity in Car8wdl mice (n = 6) appear longer than in control mice (n = 6). The scale bar represents 25 ms. (d) Car8wdl (n = 6) TA muscles fire longer individual bursts of activity, but not more frequently, than control mice (n = 6). The number of bursts and spikes are denoted in the graphs by the abbreviation, no. Bursts/Time, p = 0.3038; Burst length, * p < 0.05; Spikes/Burst, ** p < 0.01; Student’s t test; Mean ± SEM (e) Example EMG traces and waveform correlograms of P20-P24 control mice, showing the out of phase firing of TA and GC muscles, and of P20-P24 Car8wdl mice, showing overlap between TA and GC muscle firing. The scale bar represents 500 ms

Similar articles

Cited by

References

    1. Orr HT. SCA1-phosphorylation, a regulator of Ataxin-1 function and pathogenesis. Prog Neurobiol. 2012;99:179–185. - PMC - PubMed
    1. Ledoux MS, Lorden JF. Abnormal spontaneous and harmaline-stimulated Purkinje cell activity in the awake genetically dystonic rat. Exp Brain Res. 2002;145:457–467. - PubMed
    1. Wilson BK, Hess EJ. Animal models for dystonia. Mov Disord. 2013;28:982–989. - PMC - PubMed
    1. Louis ED, Faust PL, J-PG V. Purkinje cell loss is a characteristic of essential tremor. Park Relat Disord. 2011;17:406–409. - PMC - PubMed
    1. Gennarino VA, Singh RK, White JJ, De Maio A, Han K, Kim JY, et al. Pumilio1 haploinsufficiency leads to SCA1-like neurodegeneration by increasing wild-type Ataxin1 levels. Cell. 2015;160:1087–1098. - PMC - PubMed

Publication types

MeSH terms

  NODES
Note 2
twitter 2