Single-Cell Approach to Monitor the Unfolded Protein Response During Biotechnological Processes With Pichia pastoris
- PMID: 30873140
- PMCID: PMC6404689
- DOI: 10.3389/fmicb.2019.00335
Single-Cell Approach to Monitor the Unfolded Protein Response During Biotechnological Processes With Pichia pastoris
Abstract
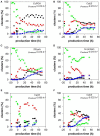
Pichia pastoris (Komagataella sp.) is broadly used for the production of secreted recombinant proteins. Due to the high rate of protein production, incorrectly folded proteins may accumulate in the endoplasmic reticulum (ER). To restore their proper folding, the cell triggers the unfolded protein response (UPR); however, if the proteins cannot be repaired, they are degraded, which impairs process productivity. Moreover, a non-producing/non-secreting subpopulation of cells might occur, which also decreases overall productivity. Therefore, an in depth understanding of intracellular protein fluxes and population heterogeneity is needed to improve productivity. Under industrially relevant cultivation conditions in bioreactors, we cultured P. pastoris strains producing three different recombinant proteins: penicillin G acylase from Escherichia coli (EcPGA), lipase B from Candida antarctica (CaLB) and xylanase A from Thermomyces lanuginosus (TlXynA). Extracellular and intracellular product concentrations were determined, along with flow cytometry-based single-cell measurements of cell viability and the up-regulation of UPR. The cell population was distributed into four clusters, two of which were viable cells with no UPR up-regulation, differing in cell size and complexity. The other two clusters were cells with impaired viability, and cells with up-regulated UPR. Over the time course of cultivation, the distribution of the population into these four clusters changed. After 30 h of production, 60% of the cells producing EcPGA, which accumulated in the cells (50-70% of the product), had up-regulated UPR, but only 13% of the cells had impaired viability. A higher proportion of cells with decreased viability was observed in strains producing CaLB (20%) and TlXynA (27%). The proportion of cells with up-regulated UPR in CaLB-producing (35%) and TlXynA-producing (30%) strains was lower in comparison to the EcPGA-producing strain, and a smaller proportion of CaLB and TlXynA (<10%) accumulated in the cells. These data provide an insight into the development of heterogeneity in a recombinant P. pastoris population during a biotechnological process. A deeper understanding of the relationship between protein production/secretion and the regulation of the UPR might be utilized in bioprocess control and optimization with respect to secretion and population heterogeneity.
Keywords: Pichia pastoris; fed-batch culture; flow cytometry; heterogeneity; single-cell; stress response; super folder green fluorescent protein (sfGFP); unfolded protein response (UPR).
Figures

full length KAR2 upstream region (FL, −324 bp);
truncated variant of KAR2 upstream region, still containing native UPRE sequence (−191 bp);
truncated variant of KAR2 upstream region with two single mutations (84C→A, 78G→A) in the UPRE sequence (−191 bp mut.); truncated variant of KAR2 upstream region lacking the UPRE sequence (−77 bp).


Similar articles
-
Engineering of the unfolded protein response pathway in Pichia pastoris: enhancing production of secreted recombinant proteins.Appl Microbiol Biotechnol. 2021 Jun;105(11):4397-4414. doi: 10.1007/s00253-021-11336-5. Epub 2021 May 26. Appl Microbiol Biotechnol. 2021. PMID: 34037840 Free PMC article. Review.
-
Fate of the UPR marker protein Kar2/Bip and autophagic processes in fed-batch cultures of secretory insulin precursor producing Pichia pastoris.Microb Cell Fact. 2018 Aug 9;17(1):123. doi: 10.1186/s12934-018-0970-3. Microb Cell Fact. 2018. PMID: 30092809 Free PMC article.
-
Production and secretion dynamics of prokaryotic Penicillin G acylase in Pichia pastoris.Appl Microbiol Biotechnol. 2020 Jul;104(13):5787-5800. doi: 10.1007/s00253-020-10669-x. Epub 2020 May 18. Appl Microbiol Biotechnol. 2020. PMID: 32424437 Free PMC article.
-
Decrease of UPR- and ERAD-related proteins in Pichia pastoris during methanol-induced secretory insulin precursor production in controlled fed-batch cultures.Microb Cell Fact. 2014 Feb 13;13(1):23. doi: 10.1186/1475-2859-13-23. Microb Cell Fact. 2014. PMID: 24521445 Free PMC article.
-
Engineering strategies for enhanced production of protein and bio-products in Pichia pastoris: A review.Biotechnol Adv. 2018 Jan-Feb;36(1):182-195. doi: 10.1016/j.biotechadv.2017.11.002. Epub 2017 Nov 10. Biotechnol Adv. 2018. PMID: 29129652 Review.
Cited by
-
Study of Potential Blocking Peptides _targeting the SARS-CoV-2 RBD/hACE2 Interaction.Pharmaceuticals (Basel). 2024 Sep 20;17(9):1240. doi: 10.3390/ph17091240. Pharmaceuticals (Basel). 2024. PMID: 39338402 Free PMC article.
-
_targeted genome editing of plants and plant cells for biomanufacturing.Transgenic Res. 2021 Aug;30(4):401-426. doi: 10.1007/s11248-021-00236-z. Epub 2021 Mar 1. Transgenic Res. 2021. PMID: 33646510 Free PMC article. Review.
-
Innovative Bioprocess Strategies Combining Physiological Control and Strain Engineering of Pichia pastoris to Improve Recombinant Protein Production.Front Bioeng Biotechnol. 2022 Jan 26;10:818434. doi: 10.3389/fbioe.2022.818434. eCollection 2022. Front Bioeng Biotechnol. 2022. PMID: 35155391 Free PMC article.
-
Komagataella phaffii as a Platform for Heterologous Expression of Enzymes Used for Industry.Microorganisms. 2024 Feb 7;12(2):346. doi: 10.3390/microorganisms12020346. Microorganisms. 2024. PMID: 38399750 Free PMC article. Review.
-
Application of In-Situ and Soft-Sensors for Estimation of Recombinant P. pastoris GS115 Biomass Concentration: A Case Analysis of HBcAg (Mut+) and HBsAg (MutS) Production Processes under Varying Conditions.Sensors (Basel). 2021 Feb 10;21(4):1268. doi: 10.3390/s21041268. Sensors (Basel). 2021. PMID: 33578904 Free PMC article.
References
LinkOut - more resources
Full Text Sources

