Melatonin Affects Mitochondrial Fission/Fusion Dynamics in the Diabetic Retina
- PMID: 31098384
- PMCID: PMC6487082
- DOI: 10.1155/2019/8463125
Melatonin Affects Mitochondrial Fission/Fusion Dynamics in the Diabetic Retina
Abstract
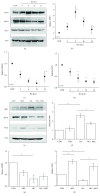
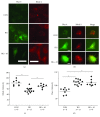
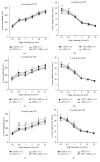
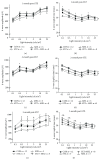
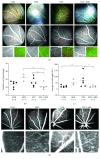
Mitochondrial fission and fusion are dependent on cellular nutritional states, and maintaining this dynamics is critical for the health of cells. Starvation triggers mitochondrial fusion to maintain bioenergetic efficiency, but during nutrient overloads (as with hyperglycemic conditions), fragmenting mitochondria is a way to store nutrients to avoid waste of energy. In addition to ATP production, mitochondria play an important role in buffering intracellular calcium (Ca2+). We found that in cultured 661W cells, a photoreceptor-derived cell line, hyperglycemic conditions triggered an increase of the expression of dynamin-related protein 1 (DRP1), a protein marker of mitochondrial fission, and a decrease of mitofusin 2 (MFN2), a protein for mitochondrial fusion. Further, these hyperglycemic cells also had decreased mitochondrial Ca2+ but increased cytosolic Ca2+. Treating these hyperglycemic cells with melatonin, a multifaceted antioxidant, averted hyperglycemia-altered mitochondrial fission-and-fusion dynamics and mitochondrial Ca2+ levels. To mimic how people most commonly take melatonin supplements, we gave melatonin to streptozotocin- (STZ-) induced type 1 diabetic mice by daily oral gavage and determined the effects of melatonin on diabetic eyes. We found that melatonin was not able to reverse the STZ-induced systemic hyperglycemic condition, but it prevented STZ-induced damage to the neural retina and retinal microvasculature. The beneficial effects of melatonin in the neural retina in part were through alleviating STZ-caused changes in mitochondrial dynamics and Ca2+ buffering.
Figures


Similar articles
-
Melatonin prevents Drp1-mediated mitochondrial fission in diabetic hearts through SIRT1-PGC1α pathway.J Pineal Res. 2018 Sep;65(2):e12491. doi: 10.1111/jpi.12491. Epub 2018 Apr 14. J Pineal Res. 2018. PMID: 29575122 Free PMC article.
-
Drp1-dependent mitochondrial fragmentation mediates photoreceptor abnormalities in type 1 diabetic retina.Exp Eye Res. 2024 May;242:109860. doi: 10.1016/j.exer.2024.109860. Epub 2024 Mar 11. Exp Eye Res. 2024. PMID: 38467174
-
Mitochondrial fusion and maintenance of mitochondrial homeostasis in diabetic retinopathy.Biochim Biophys Acta Mol Basis Dis. 2019 Jun 1;1865(6):1617-1626. doi: 10.1016/j.bbadis.2019.03.013. Epub 2019 Mar 25. Biochim Biophys Acta Mol Basis Dis. 2019. PMID: 30922813
-
The Role of Mitochondrial Dynamics and Mitotic Fission in Regulating the Cell Cycle in Cancer and Pulmonary Arterial Hypertension: Implications for Dynamin-Related Protein 1 and Mitofusin2 in Hyperproliferative Diseases.Cells. 2023 Jul 20;12(14):1897. doi: 10.3390/cells12141897. Cells. 2023. PMID: 37508561 Free PMC article. Review.
-
Diabetic retinopathy pathogenesis and the ameliorating effects of melatonin; involvement of autophagy, inflammation and oxidative stress.Life Sci. 2018 Jan 15;193:20-33. doi: 10.1016/j.lfs.2017.12.001. Epub 2017 Dec 5. Life Sci. 2018. PMID: 29203148 Review.
Cited by
-
Mini-encyclopedia of mitochondria-relevant nutraceuticals protecting health in primary and secondary care-clinically relevant 3PM innovation.EPMA J. 2024 Apr 18;15(2):163-205. doi: 10.1007/s13167-024-00358-4. eCollection 2024 Jun. EPMA J. 2024. PMID: 38841620 Free PMC article.
-
The Therapeutic Trip of Melatonin Eye Drops: From the Ocular Surface to the Retina.Pharmaceuticals (Basel). 2024 Mar 29;17(4):441. doi: 10.3390/ph17040441. Pharmaceuticals (Basel). 2024. PMID: 38675402 Free PMC article. Review.
-
Beneficial Effect of Sirolimus-Pretreated Mesenchymal Stem Cell Implantation on Diabetic Retinopathy in Rats.Biomedicines. 2024 Feb 7;12(2):383. doi: 10.3390/biomedicines12020383. Biomedicines. 2024. PMID: 38397985 Free PMC article.
-
Piceid Octanoate Protects Retinal Cells against Oxidative Damage by Regulating the Sirtuin 1/Poly-ADP-Ribose Polymerase 1 Axis In Vitro and in rd10 Mice.Antioxidants (Basel). 2024 Feb 4;13(2):201. doi: 10.3390/antiox13020201. Antioxidants (Basel). 2024. PMID: 38397799 Free PMC article.
-
REDOX Balance in Oligodendrocytes Is Important for Zebrafish Visual System Regeneration.Antioxidants (Basel). 2023 Nov 22;12(12):2026. doi: 10.3390/antiox12122026. Antioxidants (Basel). 2023. PMID: 38136146 Free PMC article.
References
MeSH terms
Substances
LinkOut - more resources
Full Text Sources
Medical
Research Materials
Miscellaneous

