. 2019 Sep 27;294(39):14289-14307.
doi: 10.1074/jbc.RA119.008923. Epub 2019 Aug 6.

Inhibition of the ULK1 protein complex suppresses Staphylococcus-induced autophagy and cell death

Affiliations

Inhibition of the ULK1 protein complex suppresses Staphylococcus-induced autophagy and cell death

Ohood A Radhi et al. J Biol Chem. .

Abstract

Autophagy plays multiple roles in host cells challenged with extracellular pathogens. Here, we aimed to explore whether autophagy inhibition could prevent bacterial infections. We first confirmed widely distinct patterns of autophagy responses in host cells infected with Staphylococcus aureus, as compared with Salmonella Only infection with Staphylococcus produced strong accumulation of lipidated autophagy-related protein LC3B (LC3B-II). Infection with virulent Staphylococcus strains induced formation of p62-positive aggregates, suggestive of accumulated ubiquitinated _targets. During Salmonella infection, bacteria remain enclosed by lysosomal-associated membrane protein 2 (LAMP2)-positive lysosomes, whereas virulent Staphylococcus apparently exited from enlarged lysosomes and invaded the cytoplasm. Surprisingly, Staphylococcus appeared to escape from the lysosome without generation of membrane-damage signals as detected by galectin-3 recruitment. In contrast, Salmonella infection produced high levels of lysosomal damage, consistent with a downstream antibacterial xenophagy response. Finally, we studied the Unc-51-like autophagy-activating kinase 1 (ULK1) regulatory complex, including the essential subunit autophagy-related protein 13 (ATG13). Infection of cells with either Staphylococcus or Salmonella led to recruitment of ATG13 to sites of cytosolic bacterial cells to promote autophagosome formation. Of note, genetic _targeting of ATG13 suppressed autophagy and the ability of Staphylococcus to infect and kill host cells. Two different ULK1 inhibitors also prevented Staphylococcus intracellular replication and host cell death. Interestingly, inhibition of the ULK1 pathway had the opposite effect on Salmonella, sensitizing cells to the infection. Our results suggest that ULK1 inhibitors may offer a potential strategy to impede cellular infection by S. aureus.

Keywords: Salmonella enterica; Staphylococcus aureus (S. aureus); Unc-51-like autophagy-activating kinase 1 (ULK1); autophagy; autophagy-related protein 13 (ATG13); bacterial pathogenesis; bacterial virulence; infection; intracellular pathogen; xenophagy.


Conflict of interest statement

The authors declare that they have no conflicts of interest with the contents of this article

Figures

Figure 1.
Figure 1.
Activation of autophagy in HeLa cells following invasion of S. aureus and S. enterica sv. typhimurium. HeLa cells were infected (Inf.) with S. aureus (ATCC29213) or S. enterica sv. typhimurium (NCTC13347) using two different protocols (see “Experimental procedures”). A, using the Staphylococcus protocol, bacteria were grown until OD = 0.3 and used to infect cells at 200 m.o.i. One hour post-infection, gentamicin (Gent.) (0.05 mg/ml) was added to inactivate extracellular bacteria, and the infection proceeded for a further 2 h. As control, cells were treated with EBSS (amino acid and serum starvation) or chloroquine (CQ) 25 μm and incubated for 3 h. Cell lysates were resolved by gel electrophoresis, and proteins were probed with anti-LC3B antibody. Activation of autophagy was measured via ratio of LC3B-II/LC3B-I. Average from n = 3 experiments ± S.D. is shown. *, p < 0.001 by ANOVA and Tukey's post test. Uninf., uninfected. B, using the Salmonella protocol, bacteria were grown until OD = 1.2–1.5 and then diluted 1:100. This diluted culture was used to infect cells for 20 min and then changed to fresh cell media (Med.) containing gentamycin. Infected (or control autophagy-stimulated) cells were lysed after 1 h and analyzed for LC3B lipidation. The average from n = 3 samples ± S.D. is shown. A and B, repeated three times on different days. C, HeLa cells were infected with S. aureus strains (ATCC29213, clonal complex 8 isolate (CC8), NCTC8325, NRS144 agr-mutant, or EMRSA LF78) or S. enterica sv. typhimurium (n = 3). Cells were infected at 200 m.o.i. One hour post-infection, gentamycin was added, and cells were further incubated for 3 h. Average from three samples ± S.D. is shown. Data are representative of two experiments. *, p < 0.001 by ANOVA and Tukey's post test. D, HeLa cells were infected with ATCC29213 at 100 m.o.i. Top, cells were further incubated for up to 6 h. Bottom, gentamicin (0.05 mg/ml) was added 1 h after infection. n = 2 replicates per condition.
Figure 2.
Figure 2.
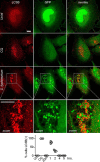
Autophagosome formation following infection by S. enterica sv. typhimurium. HeLa cells were plated on glass coverslips. As control, cells were treated with chloroquine (CQ, 25 μm) for 3 h to cause autophagosome accumulation. Alternatively, cells were infected with 1:100 m.o.i. of GFP-expressing S. enterica sv. typhimurium for 1 h using the Salmonella protocol. After treatments, cells were fixed and stained for LC3B(+) membranes. All scale bars: 10 μm. Zoom: ×3.4 magnification. Bottom, HeLa cells were infected as above with 1:100 m.o.i. GFP–Salmonella and incubated for 20 min and 1–3 or 5 h. Note: except for the 20-min time point, gentamycin was added 50 min after infection. The percentage of cells positive for LC3B puncta was counted (50–100 cells counted per sample). Average from n = 3 samples ± S.D. Uninf., uninfected.
Figure 3.
Figure 3.
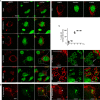
Differential formation of p62/Sequestosome1-positive membranes following infection by Staphylococcus versus Salmonella. A, HeLa/GFP–p62 cells were infected with 100 m.o.i. NCTC8325 for 3 h (gentamicin added after 1st h). After fixation, bacteria were detected by anti-protein A staining. Arrow, p62(+) aggregate. All scale bars, 10 μm. All zoom: ×3.4 magnification. B, HeLa cells were treated with chloroquine as control (CQ, 25 μm) or infected as above with indicated strains of S. aureus. After fixation, cells were stained with antibodies for p62/SQSTM1 and Hoechst 33342 (detects bacterial and host cell DNA). Arrows: large size p62(+) aggregates. C, HeLa cells were infected with 1:100 diluted GFP–S. enterica sv. typhimurium for 1 h before fixation and staining with antibodies for p62/SQSTM1. Arrowhead, co-localization of p62 on Salmonella. D, HeLa cells were infected with GFP–Salmonella as in C for the indicated times before fixation. The percentage of cells positive for p62(+) membranes was counted (40–110 cells counted per sample). Average from n = 3 samples ± S.D. Uninf., uninfected.
Figure 4.
Figure 4.
Intracellular Staphylococcus stimulates autophagosome formation. A, HeLa cells were infected with 200 m.o.i. NCTC8325 for 3 h. Where indicated, cell infections included cytochalasin D (CytoD) (micromolar). Activation of autophagy was measured via LC3B-II/LC3B-I. Average from n = 3 experiments ± S.D. B, HeLa/GFP–p62 cells were infected with 100 m.o.i. NCTC8325 for 3 h (gentamicin added after first 1 h of infection). After fixation, cells were stained for protein A and Hoechst 33342. Where indicated, cells were stained without permeabilization by Triton X-100. Scale bar, 10 μm. C, HeLa/GFP-LC3 cells were infected and stained as in B.
Figure 5.
Figure 5.
Autophagosomes generated following Staphylococcus infection do not show rapid flux. A, HeLa cells were infected with 200 m.o.i. NCTC8325 or alternatively starved in EBSS for 3 h. Where indicated, cell treatments included bafilomycin (Baf) A1 (10 nm). Cell lysates were resolved by gel electrophoresis and probed with anti-LC3B antibody. Activation of autophagy was measured via LC3B-II/LC3B-I. Average from n = 3 experiments ± S.D. B, HeLa/GFP-LC3 cells were infected with 100 m.o.i. NCTC8325 for 3 h (gentamicin added after first 1 h of infection). Where indicated, cell treatments included bafilomycin A1 (10 nm). After fixation, cells were stained with antibodies for p62/SQSTM1 and Hoechst 33342. Scale bar, 10 μm. Arrows, large size p62(+)-GFP-LC3(+) aggregates. Shown are percentage the of cells (+) for large-size autophagosomes (n = 3 samples ± S.D.; 100–250 cells counted per sample). Uninf., uninfected.
Figure 6.
Figure 6.
Escape of virulent strains of S. aureus from swollen lysosomes. A, HeLa cells were treated with chloroquine as control for 3 h (CQ, 25 μm) or infected as in Fig. 3B with different strains of S. aureus (100 m.o.i., 3 h). After fixation, cells were stained with antibodies for LAMP-2 and Hoechst 33342 (detects bacterial and host cell DNA). All scale bars, 10 μm. Arrow, zoomed inset: S. aureus after escape from LAMP-2(+) lysosomes. Zoom: ×3.4 magnification. B, HeLa cells were infected with 1:100 diluted GFP-S. enterica sv. typhimurium. After 5 h, cells were fixed and stained for LAMP-2. Arrowhead, zoomed inset: Salmonella still confined within LAMP-2(+) lysosomes. Zoom: ×1.9 magnification. C, HeLa cells infected with GFP–Salmonella as in B for different times were quantified for percentage of cells containing swollen LAMP-2(+) lysosomes (40–85 cells counted per sample). Average from n = 3 samples ± S.D. Uninf., uninfected.
Figure 7.
Figure 7.
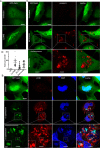
S. aureus infection does not generate lysosome damage signals. A and C, HeLa cells were transfected to express GFP–galectin-3 (GFP–Gal3). As control, cells were treated with LLOME (2 mm for 3 h) to induce lysosomal damage and Gal3(+) puncta. C, alternatively, cells were infected with S. aureus NCTC8325 (100 m.o.i., 5 h). All (nonlabeled) scale bars, 10 μm. Zoom: ×3.0 magnification. B, HeLa cells transfected with GFP–Gal 3 were infected with 1:100 diluted S. enterica sv. typhimurium for 3 h (gentamicin added after first 50 min of infection). Cells were fixed and co-stained with LC3B antibody (to detect autophagosomes) and DAPI (to detect Salmonella). Arrow, zoomed insets: LC3B recruitment to sites of Salmonella-induced lysosomal damage marked by Gal3. Zoom: ×3.6 magnification (with further ×2.0 magnification, inset). D, HeLa cells transfected with GFP–Gal 3 were infected with 1:100 diluted S. enterica sv. typhimurium (using Salmonella protocol) or 100 m.o.i. of NCTC8325 (using Staphylococcus protocol) for 5 h (for comparison, positive control cells were treated with LLOME for 3 h). Gal3 puncta were quantified. Average puncta/cells were from n = 50–100 cells from two independent experiments ± S.D.
Figure 8.
Figure 8.
Death of host cells upon infection by Staphylococcus and Salmonella. A, indicated host cell lines were infected with 100 m.o.i. of varying Staphylococcus strains (ATCC29263, CC8, NCTC8325, or EMRSA LF78). After 1 h of infection, gentamicin was added to the media, and cells were further incubated for 72 h before fixation and Giemsa staining of remaining viable cells. B, HeLa cells were infected as indicated with 200 m.o.i. S. aureus for 72 h (gentamycin added after 1st h of infection). Viable cells staining with Giemsa were quantified via absorbance. Average from n = 3 ± S.D. Data are representative of two experiments. **, p < 0.001; *, p < 0.01 by ANOVA and Tukey's post test. C, HeLa cells were infected as indicated with varying multiplicities of infection and quantified as in B. Average is from n = 3 ± S.D. D, HeLa or HEK293A cells were infected with 1:100 diluted S. enterica sv. typhimurium (using Salmonella protocol) and incubated for 72 h before fixation, staining, and quantification. Average is from n = 3 ± S.D. Uninf., uninfected.
Figure 9.
Figure 9.
Staphylococcus and Salmonella infection both promote recruitment of ATG13 to autophagosome membranes. A, as control, HeLa cells were left untreated or starved in EBSS for 1 h before fixation and antibody staining to detect endogenous ATG13. Scale bars, 10 μm. B, HeLa cells were infected with 1:100 diluted S. enterica sv. typhimurium for 1 h and stained as in A. C, HeLa/GFP–ATG13 cells were starved as in A. D, HeLa/GFP–ATG13 cells were infected with S. aureus NCTC8325 for 3 h, fixed, and stained with anti-protein A antibody. Zoomed insets (×2.0 magnification) highlight ATG13 localizing to invading Salmonella or Staphylococcus. E, HeLa/GFP–ATG13 cells were untreated, starved in EBSS, or infected with S. enterica sv. typhimurium for 1 h. For comparison, cells were infected with NCTC8325 for 3 h. After fixation, cells were stained with DAPI, and GFP–ATG13(+) puncta were quantified. Average puncta/cell from n = 50 cells ± S.D. (representative of two independent experiments). Uninf., uninfected.
Figure 10.
Figure 10.
Inhibition of ATG13-dependent autophagy suppresses Staphylococcus-induced cell death. A, ATG13 was _targeted in HEK293A cells using the CRISPR–Cas9 system (CR–ATG13). WT HEK293A or CR–ATG13 cells were treated to bafilomycin A1 (Baf) (10 nm) ± starvation (St) in EBSS for 2 h. Cell lysates were analyzed for LC3B lipidation as in Fig. 1. n = 2 ± range. B and C, WT HEK293A or CR–ATG13 cells were starved in EBSS for 2 h, fixed, and stained to detect LC3B puncta. Average puncta/cell were from n = 36 cells ± S.D. Scale bar, 10 μm. D, WT HEK293A or CR–ATG13 cells were infected with varying multiplicities of infection of S. aureus NCTC8325 and assayed for cell viability as in Fig. 6. **, p < 0.001; *, p < 0.01 by unpaired t test: CR–ATG13 versus 293A (comparing equivalent multiplicities of infection). E, WT HEK293A or CR–ATG13 cells were infected with 1:100 diluted S. enterica sv. typhimurium and incubated for 24 or 48 h before staining for cell viability. Averages are from n = 3 ± S.D. a, p = 0.054 by t test: infected CR–ATG13 versus 293A at 24 h.
Figure 11.
Figure 11.
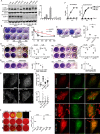
Inhibition of ULK1 suppresses Staphylococcus intracellular replication and host cell death. A, ULK1 was _targeted in HeLa cells using shRNA (shULK1). WT HeLa or shULK1 cells were treated to bafilomycin A1 (10 nm) ± starvation (St+Baf) in EBSS for 2 h. Cell lysates were analyzed and quantified for LC3B lipidation as in Fig. 1. n = 2 ± range. B, WT HeLa or shULK1 cells were infected with varying multiplicities of infection of S. aureus NCTC8325 and assayed for cell viability as in Fig. 6. Averages of n = 3 ± S.D. ***, p < 0.001; *, p < 0.05 by unpaired t test: shULK1 versus HeLa. C, WT HeLa or shULK1 cells were infected with 1:100 diluted S. enterica sv. typhimurium and incubated for 72 h before staining for cell viability. Averages of n = 3 ± S.D. **, p < 0.01 by unpaired t test. D, HEK293A cells were infected with NCTC8325 (200 m.o.i.). At the time of infection, ULK1 inhibitors MRT68921 or SBI-0206965 were added at 1 or 10 μm. Gentamycin (0.05 mg/ml) was added 1 h post-infection. Cells were incubated for 48 h and assayed for cell viability as in Fig. 6. Averages of n = 3 ± S.D. E, HEK293A cells were infected with 1:100 diluted Salmonella as in C. At the time of infection, ULK1 inhibitors were added at 10 μm. Gentamycin was added 50 min post-infection. Cells were incubated for 24 h and assayed for cell viability. Shown are averages from n = 3 ± S.D. D and E, ***, p < 0.0001; **, p < 0.001; *, p < 0.05 by unpaired t test: infected cells comparing (+) versus (−) ULK1 inhibitor. F, Staphylococcus NCTC8325 or S. enterica sv. typhimurium cultures were diluted 1:100 and grown in the presence of ULK1 inhibitors (10 μm) or gentamicin (0.05 mg/ml). Averages of n = 3 ± S.D. G and H, HeLa cells were incubated in EBSS for 2 h in the presence or absence of ULK1 inhibitors (10 μm). After fixation, cells were stained with anti-LC3B antibody. Scale bars, 10 μm. Average LC3B(+) puncta/cell from n = 40 cells per condition ± S.E. **, p < 0.001 versus starved no-drug control by ANOVA and Tukey's post test. I and J, HeLa/GFP–p62 stable cells were infected with NCTC8325 (100 m.o.i.) for 3 h in the presence or absence of ULK1 inhibitors (10 μm). After fixation, cells were stained with anti-protein A antibody. Scale bars, 10 μm. Arrow, large-sized p62 aggregates induced by NCTC8325 infection. Average large GFP–p62 aggregates/cell from n = 20 cells per condition ± S.E. Data are representative of two experiments. K, HEK293A cells were infected with NCTC8325 (100 m.o.i.) in the presence of MRT68921 (MRT) (1 μm) or SBI-0206965 (SBI) (10 μm). Gentamycin (0.05 mg/ml) was added 1 h post-infection. Cells were further incubated 3, 6 or 24 h before lysis. Bacterial titers in cell lysates were measured by growth on solid media. Average CFU from 3- and 6-h time points (n = 3 ± S.D.) are shown. Bacterial growth changes color of phenol red in bacterial plates. No host cells remained 24 h after infection in the absence of ULK1 inhibitor. Uninf., uninfected.

Similar articles

Cited by

References

    1. Yu L., Chen Y., and Tooze S. A. (2018) Autophagy pathway: cellular and molecular mechanisms. Autophagy 14, 207–215 10.1080/15548627.2017.1378838 - DOI - PMC - PubMed
    1. Birmingham C. L., Smith A. C., Bakowski M. A., Yoshimori T., and Brumell J. H. (2006) Autophagy controls Salmonella infection in response to damage to the Salmonella-containing vacuole. J. Biol. Chem. 281, 11374–11383 10.1074/jbc.M509157200 - DOI - PubMed
    1. Gutierrez M. G., Master S. S., Singh S. B., Taylor G. A., Colombo M. I., and Deretic V. (2004) Autophagy is a defense mechanism inhibiting BCG and Mycobacterium tuberculosis survival in infected macrophages. Cell 119, 753–766 10.1016/j.cell.2004.11.038 - DOI - PubMed
    1. Zhao Z., Fux B., Goodwin M., Dunay I. R., Strong D., Miller B. C., Cadwell K., Delgado M. A., Ponpuak M., Green K. G., Schmidt R. E., Mizushima N., Deretic V., Sibley L. D., and Virgin H. W. (2008) Autophagosome-independent essential function for the autophagy protein Atg5 in cellular immunity to intracellular pathogens. Cell Host Microbe 4, 458–469 10.1016/j.chom.2008.10.003 - DOI - PMC - PubMed
    1. Py B. F., Lipinski M. M., and Yuan J. (2007) Autophagy limits Listeria monocytogenes intracellular growth in the early phase of primary infection. Autophagy 3, 117–125 10.4161/auto.3618 - DOI - PubMed

Publication types

MeSH terms

Substances

  NODES
Note 2
twitter 2