. 2019 Aug 23;14(8):e0221366.
doi: 10.1371/journal.pone.0221366. eCollection 2019.

Aging- and obesity-related peri-muscular adipose tissue accelerates muscle atrophy

Affiliations

Aging- and obesity-related peri-muscular adipose tissue accelerates muscle atrophy

Shunshun Zhu et al. PLoS One. .

Abstract

Sarcopenia due to loss of skeletal muscle mass and strength leads to physical inactivity and decreased quality of life. The number of individuals with sarcopenia is rapidly increasing as the number of older people increases worldwide, making this condition a medical and social problem. Some patients with sarcopenia exhibit accumulation of peri-muscular adipose tissue (PMAT) as ectopic fat deposition surrounding atrophied muscle. However, an association of PMAT with muscle atrophy has not been demonstrated. Here, we show that PMAT is associated with muscle atrophy in aged mice and that atrophy severity increases in parallel with cumulative doses of PMAT. We observed severe muscle atrophy in two different obese model mice harboring significant PMAT relative to respective control non-obese mice. We also report that denervation-induced muscle atrophy was accelerated in non-obese young mice transplanted around skeletal muscle with obese adipose tissue relative to controls transplanted with non-obese adipose tissue. Notably, transplantation of obese adipose tissue into peri-muscular regions increased nuclear translocation of FoxO transcription factors and upregulated expression FoxO _targets associated with proteolysis (Atrogin1 and MuRF1) and cellular senescence (p19 and p21) in muscle. Conversely, in obese mice, PMAT removal attenuated denervation-induced muscle atrophy and suppressed upregulation of genes related to proteolysis and cellular senescence in muscle. We conclude that PMAT accumulation accelerates age- and obesity-induced muscle atrophy by increasing proteolysis and cellular senescence in muscle.


Conflict of interest statement

The authors have declared that no competing interests exist.

Figures

Fig 1
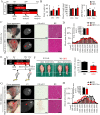
Fig 1. PMAT deposition is positively correlated with sarcopenia.
(A) Body weight (BW), muscle weight (MW) and MW/BW ratio in young and aged mice. (B) Representative CT images (left panels) and the fat ratio based on CT analysis (right panel) in lower limbs of young and aged mice. (C) Representative HE staining (left panels), quantified distribution (middle panel) and average muscle fiber cross-sectional area (CSA) (right panel) in lower limbs of young and aged mice. (D) Representative ATPase staining (left panels), distribution CSA of type II muscle fibers (middle panel) and average CSA of type I (white cells in left panel) and type II (black cells in left panel) muscle fibers in lower limbs in young and aged mice (right panel) (n = 50–100, type I; n = 1200–1500, type II). (E, F) Relative levels of transcripts marking skeletal muscle myosin subtypes (Myh7, Myh2, Myh1 and Myh4) (E), cellular senescence (p16, p19, p21 and p57), and protein degradation (Atrogin1 and Murf1) (F) in gastrocnemius of young and aged mice. Transcript levels were normalized to 18s mRNA; values in young mice were set to 1. Young mice were 3-6-months-old and aged mice were 18-22-months-old. (Scale bar: 100μm in c, d). (n = 6–8 per group in a, e, f). All data are presented as means±S.E. Statistical significance was determined by Student’s t-test. *, p<0.05; **, p<0.01; †, p<0.001.
Fig 2
Fig 2. Aged mice exhibit PMAT increases with aggravated sarcopenia.
(A) Representative CT images (left panels) and calculated fat ratio in lower limbs (right panel) in aged mice with less than (<5%) and equal to or more than 5% (≧5%) PMAT. (B) Body weight (BW), muscle weight (MW) and MW/BW ratio in aged mice in both groups (n = 6 per group). (C) Representative HE staining in aged mice in both groups (left panels; scale bar 100μm) and quantified distribution (middle panel) and average CSA of muscle fibers (right panel) (n = 1200–1500 per group) in aged mice of both groups. (Scale bar: 100μm in C). Data are presented as means±S.E. Statistical significance was determined by Student’s t-test. *, p<0.05; **, p<0.01; †, p<0.001.
Fig 3
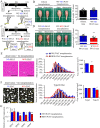
Fig 3. PMAT increases in obese mice and is accompanied by accelerated skeletal muscle atrophy.
(A) Schematic showing protocol used in high fat diet (HFD) experiments. (B) Body weight (BW), muscle weight (MW) and MW/BW ratio in mice fed a HFD for 12 and 24 weeks relative to control mice fed a normal diet (ND) (n = 6 per group). (C and G) Representative gross appearance of lower limbs, CT images, Oil Red O staining and HE staining from WT mice fed a HFD (lower panels) for 12 (C) or 24 (G) weeks relative to mice fed a ND (upper panels). (D and H) Quantified distribution and average muscle fiber CSA (n = 1200–1500 per group) in WT mice fed indicated diets for 12 (D) or 24 (H) weeks. (E) Schematic showing sciatic denervation protocol with WT-ND and WT-HFD mice in which the latter group began a HFD at 8 weeks. (F) Representative samples of gastrocnemius (left panels) plus quantification of tissue weight relative to sham (shown as a %) (right panel) in mice fed a ND or HFD after 2 weeks of denervation or following sham operation. All data are presented as means±S.E. Statistical significance was determined by Student’s t-test. *, p<0.05; **, p<0.01; †, p<0.001.
Fig 4
Fig 4. Transplant of adipose tissue to WT from obese mice aggravates muscle atrophy.
(A and B) Effect of iWAT transplantation from WT mice fed a ND (WT-ND) on denervation-induced muscle atrophy. (A) Schematic showing sciatic denervation model with or without transplantation of iWAT from WT-ND. (B) Representative samples of gastrocnemius (left panels) plus quantification (right panel) of tissue weight relative to sham (shown as a %) in mice with or without iWAT transplantation after 2 weeks of denervation or following sham operation. (C-G) Effect of iWAT transplantation from WT mice fed a HFD (WT-HFD) on denervation-induced muscle atrophy compared to iWAT transplantation from WT-ND. (C) Schematic showing sciatic denervation model with or without transplantation of iWAT from WT-ND or WT-HFD. (D) Representative samples of gastrocnemius (left panels) plus quantification (right panel) of tissue weight relative to sham (shown as a %) in mice transplanted with ND or HFD iWAT after 2 weeks of denervation or sham operation. (E) Representative images of muscle HE staining (left panels), the calculated distribution (middle panel) and average muscle CSA (right panel) (n = 1200–1500 per group) in denervated mice transplanted with ND or HFD iWAT. (F) Representative images of muscle ATPase staining (left panels), the calculated distribution of type II (black cells in left panels) muscle fibers (middle panel), and average muscle CSA of type I and type II (white cells in left panels) muscle fibers (right panel) (n = 1200–1500 per group for type II muscle, n = 50–100 per group for type I muscle). (G) Relative levels of transcripts marking skeletal muscle myosin subtypes in muscle from mice transplanted with ND or HFD iWAT (n = 6 per group). Scale bar, 100μm in (E) and (F). All data are presented as means±S.E. Statistical significance was determined by Student’s t-test. *, p<0.05; **, p<0.01; †, p<0.001.
Fig 5
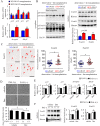
Fig 5. The presence of PMAT induces muscle senescence and up-regulates FoxO-Atrogin1/Murf1 signaling.
(A) Relative transcript levels of senescence-related genes (p16, p19, p21 and p57) and Atrogin1 Murf1 in skeletal muscle of mice transplanted with ND or HFD iWAT (n = 6 per group). (B) Representative western blot images of phosphorylated FoxO3 and FoxO1 protein in the cytoplasm (left panel) and corresponding total protein in the nucleus (right top panel) of skeletal muscle from mice transplanted with ND or HFD iWAT. Corresponding quantification of total FoxO3 and FoxO1 protein in the nucleus (right bottom panel) (n = 3 per group). Hsc70 or Histone staining served as internal loading controls. (C) Representative images (left panels) and quantification (right panels) of the number of nuclear FoxO1- or FoxO3-positive cells in skeletal muscle from mice transplanted with ND or HFD iWAT. (D) Representative images (top panels) and quantified diameters (bottom panel) of differentiated C2C12 myotubes after PAI-1 and dexamethasone (Dex) treatment. (E) Relative expression of cellular senescence-related transcripts (p21, p57) and Atrogin1 and Murf1 mRNAs in differentiated C2C12 myotubes after PAI-1 and Dex treatment (n = 6–8 per group). (F) Representative western blot images (left panel) and corresponding quantification (right panels) of FoxO3 and FoxO1 proteins in the nucleus of differentiated C2C12 myotubes (n = 3 per group). Scale bar in (c) and (d), 100μm). All data are presented as means±S.E. Statistical significance was determined by Student’s t-test. *, p<0.05; **, p<0.01; †, p<0.001.
Fig 6
Fig 6. PMAT removal from obese mice protects against skeletal muscle atrophy.
(A) Schematic showing protocol for sciatic denervation with or without PMAT resection in mice fed a HFD for 24 weeks. (B) Shown are representative samples of gastrocnemius (left panels) plus quantification (right panel) of tissue weight relative to sham (shown as a %) in mice with or without PMAT resection after 2 weeks of denervation or sham operation. (C) Representative images of muscle HE staining (left panels), calculated distribution (middle panel) and average muscle fiber CSA (right panel) (n = 1200–1500 per group) in the sciatic denervation model with or without PMAT resection. (D) Representative images of muscle ATPase staining (left panels), quantified distribution of type II muscle fibers (middle panel), and the average CSA of type I (black cells in left panels) or type II (white cells in left panels) muscle fibers (right panel) (n = 1200–1500 per group; scale bar, 100μm in c and d) from a sciatic denervation model, with or without PMAT resection. (E and F) Relative levels of transcripts marking skeletal muscle myosin subtypes (E), cellular senescence (F, left panel) and protein degradation (F, right panel) in the sciatic denervation model, with or without PMAT resection (n = 6 per group). All data are presented as means±S.E. Statistical significance was determined by Student’s t-test. *, p<0.05; †, p<0.001.

Similar articles

Cited by

References

    1. Choi KM. Sarcopenia and sarcopenic obesity. 2016; 31(6):1054–60. 10.3904/kjim.2016.193 - DOI - PMC - PubMed
    1. Doherty TJ. Invited review: Aging and sarcopenia. 2003; 95(4):1717–27. 10.1152/japplphysiol.00347.2003 - DOI - PubMed
    1. Curcio F, Ferro G, Basile C, Liguori I, Parrella P, Pirozzi F, et al. Biomarkers in sarcopenia: A multifactorial approach. 2016; 85(1–8). 10.1016/j.exger.2016.09.007 - DOI - PubMed
    1. Batsis JA, Villareal DT. Sarcopenic obesity in older adults: aetiology, epidemiology and treatment strategies. 2018; 14(9):513–37. 10.1038/s41574-018-0062-9 - DOI - PMC - PubMed
    1. Baumgartner RN. Body composition in healthy aging. 2000; 904(437–48. 10.1111/j.1749-6632.2000.tb06498.x - DOI - PubMed

Publication types

MeSH terms

Grants and funding

This work was supported by the Japan Society for the Promotion of Science, Grant 17H05652 (to Y. O.), the Core Research for Evolutional Science and Technology (CREST) Program of the Japan Science and Technology Agency (JST) Grant 13417915 (to Y. O.), the CREST Program of the Japan Agency for Medical Research and Development (AMED) Grant 18gm0610007 (to Y. O.), and by the Project for Elucidating and Controlling Mechanisms of Aging and Longevity from AMED Grant 17gm5010002 (to Y. O.). The funders had no role in study design, data collection and analysis, decision to publish, or preparation of the manuscript.
  NODES
Association 2
INTERN 1
Project 1
twitter 2